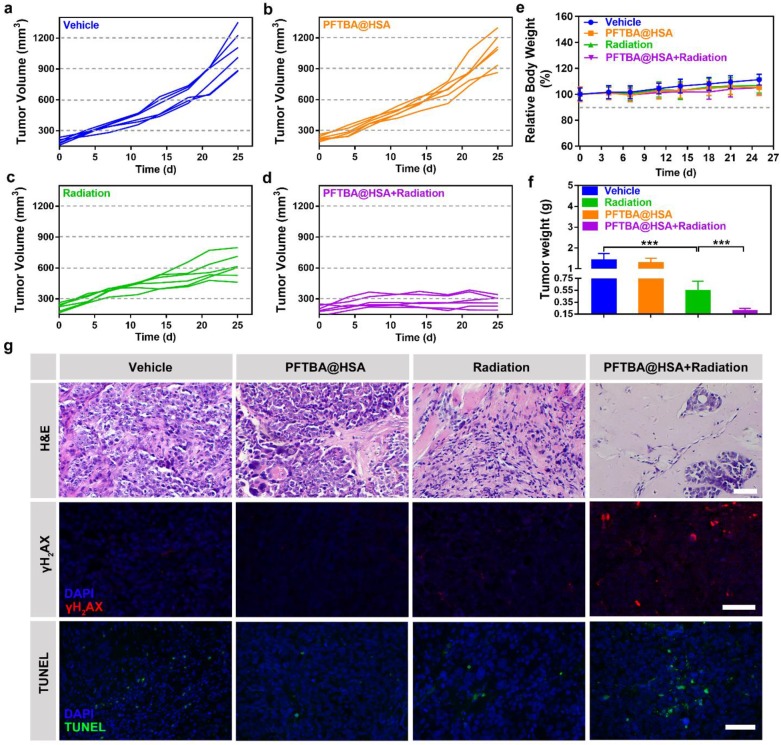
Figure 6.
Effects of PFTBA@HSA on radiotherapy in the SUM149PT tumor model. (A-D) Tumor growth curves of SUM149PT tumor-bearing mice after different treatments (n=6). (E) Relative mice bodyweight curves (n=6). (F) Tumor weight detected at day 25 post-treatments (n=6). (G) Representative images of H&E staining, γH2AX staining and TUNEL staining of SUM149PT tumors; scale bar = 50 μm. Data are shown as the mean ± SD. Statistical analyses were performed via one-way ANOVA test. ***p<0.001.

