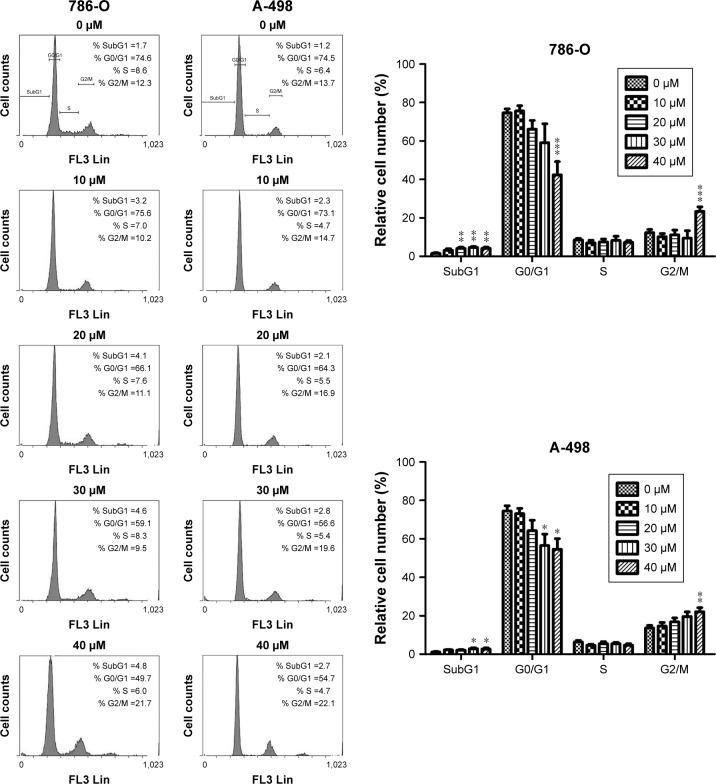
Figure 2.
Cells (786-O and A-498) were treated with 0.1% DMSO or CD (10–40 µM) for 24 hours.
Notes: Cell cycle distribution was analyzed using flow cytometry. The cell population in the different phases of the cell cycle is demonstrated as a percentage. Representative images of flow cytometry analysis are displayed. Results are shown as mean±SD from 12 independent experiments. *P<0.05, **P<0.01, ***P<0.001 compared with the control (0 µM group).
Abbreviations: CD, 16-hydroxycleroda-3,13-dien-15,16-olide; DMSO, dimethyl sulfoxide.

