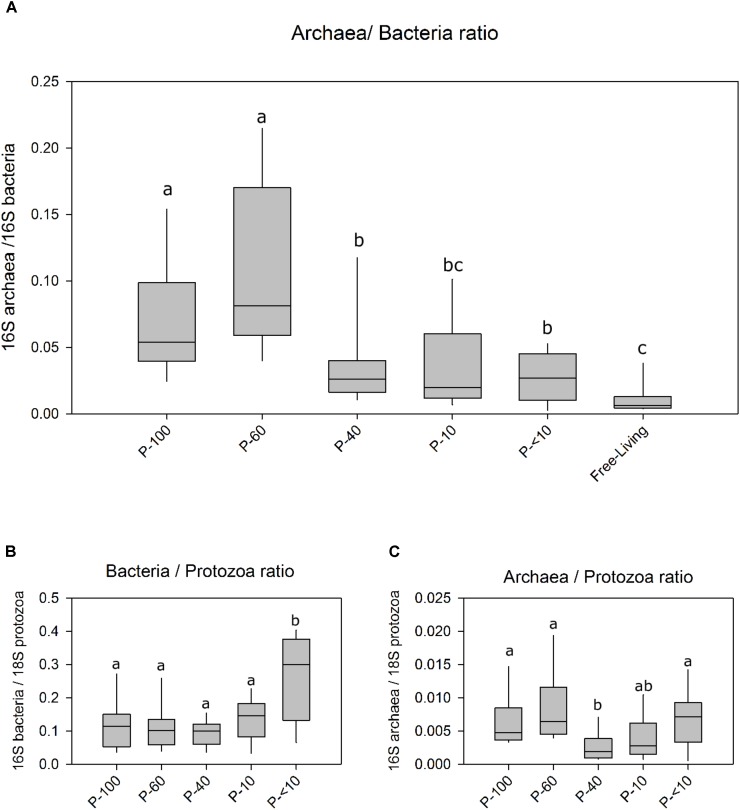
FIGURE 1.
Ratios of bacteria archaea and protozoa across the different fractions using real-time PCR. (A) The ratio between archaea 16S and the bacteria 16S in the free living rumen community and each protozoa fraction obtained by size filtering. (B) The ratio between bacterial 16S copies and protozoa 18S. (C) The ratio between archaea 16S copy number against the protozoa 18S copies. Boxes represent the interquartile range (IQR) between the first and third quartiles (25th and 75th percentiles, respectively) and the horizontal line inside the box defines the median. Whiskers represent the lowest and highest values within 1.5 times the IQR from the first and third quartiles, respectively. Significance was performed using the Wilcoxon rank sum test corrected for multiple comparisons using the Benjamini–Hochberg procedure. The lettering above the boxes indicates the corrected significance between the fractions with boxes not sharing a letter being significantly different at P < 0.05.

