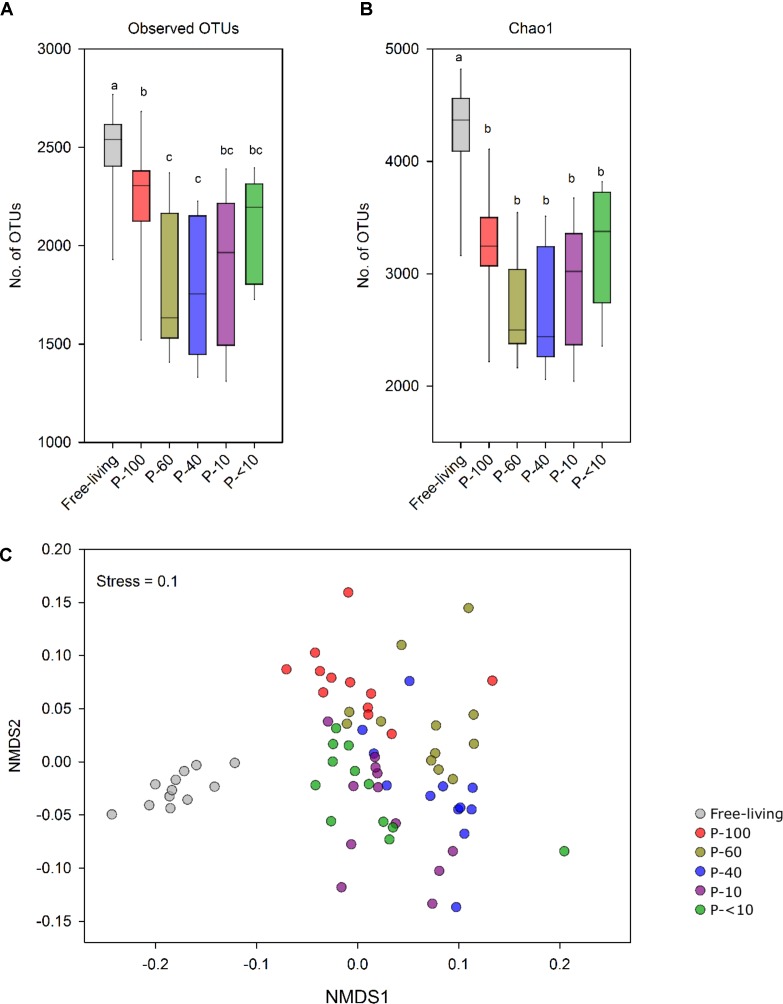
FIGURE 3.
Prokaryotic population structure across the different fractions. (A) OTU richness (≥97% similarity) and (B) Chao1 index of the free-living and protozoa associated prokaryotic community. (C) Non-metric multidimensional scaling (NMDS) based on the OTU similarity matrix obtained using the Bray–Curtis index. Each point represents a different sample plotted according to their OTU composition and abundance. A greater distance between two points infers a lower similarity between the prokaryotic community compositions. Color-coding represents the different fractions assessed.

