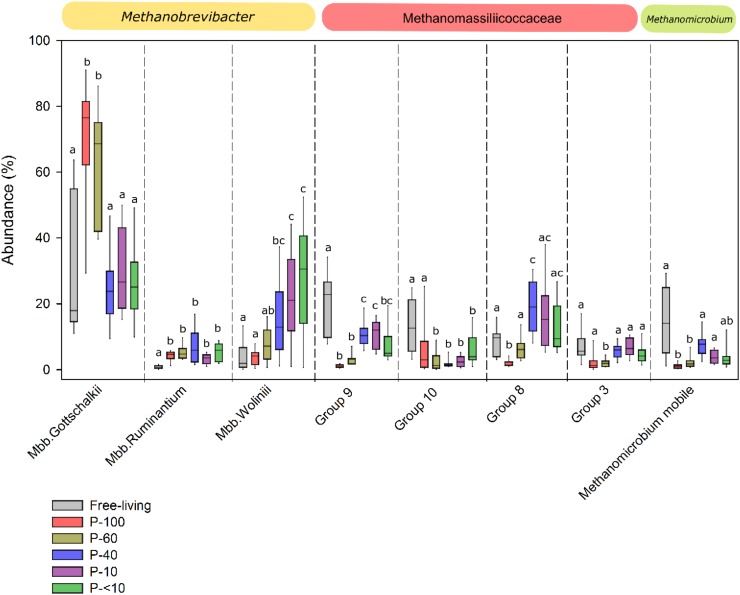
FIGURE 4.
Methanogens composition across the different fractions. Box plot representing the taxonomic distribution methanogens across the different fractions. The taxa are defined according to the lowest taxonomic assignment obtained using RIM-DB database and their corresponding family or genus affiliation is emphasized above each plot. Boxes represent the interquartile range (IQR) between the first and third quartiles (25th and 75th percentiles, respectively) and the horizontal line inside the box defines the median. Whiskers represent the lowest and highest values within 1.5 times the IQR from the first and third quartiles, respectively. The lettering above the boxes denotes the Benjamini–Hochberg corrected significance across the different groups with boxes not sharing a letter being significantly different at P < 0.05.

