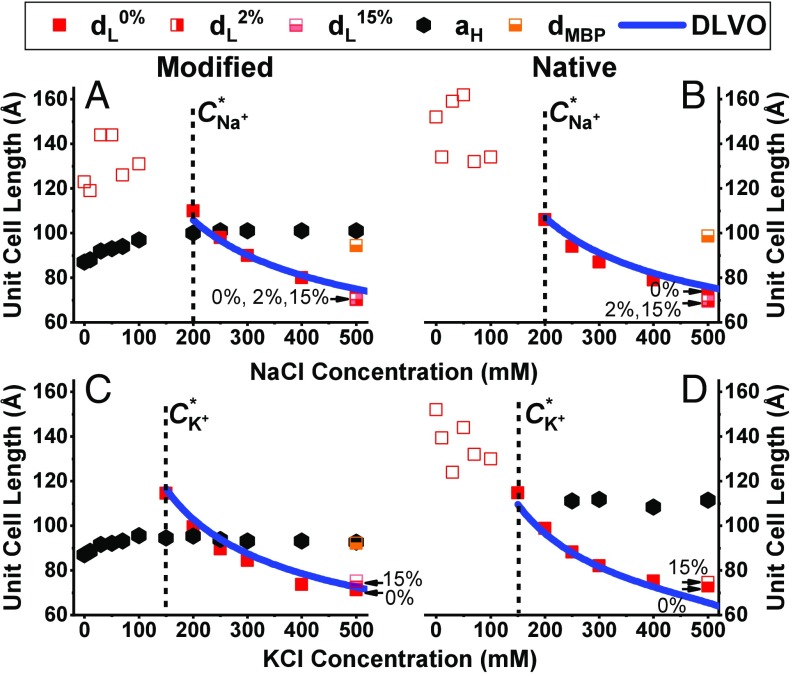
Fig. 1.
Unit cell lengths ( and ) for increasing monovalent salt concentrations. (A–D) Modified (A and C) and native (B and D) lipid compositions unit cell length at increasing NaCl (A and B) and KCl (C and D) concentrations from 0 to 500 mM. The solid line is a DLVO fitting using Eq. 1. In B, the only free parameter is the Hamaker constant, while in A, C, and D the free parameter is the surface charge, , using the same Hamaker constant from 1B fit. The unfilled symbols represent an unordered phase. The dotted lines indicate the monovalent ions’ transition concentration, C*. Samples with low (2 wt%) and high (15 wt%) MBP content are marked with half-filled symbols. The additional lamellar phase in the presence of 15 wt% MBP is denoted as dMBP (orange squares).

