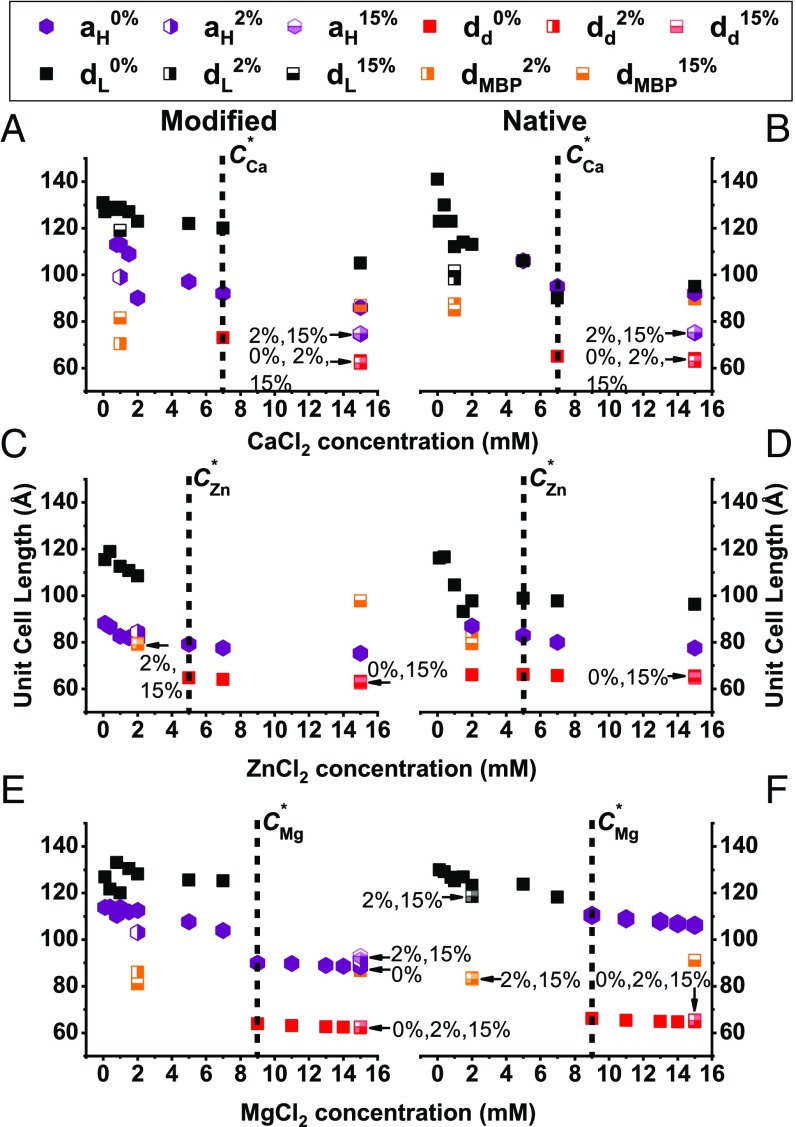
Fig. 2.
Unit cell lengths at increasing divalent salt concentrations. (A–F) Modified (A, C, and E) and native (B, D, and F) lipid compositions’ unit cell length at increasing CaCl2 (A and B), ZnCl2 (C and D), and MgCl2 (E and F) concentrations from 0 to 15 mM. The transition concentrations (C*) are marked with the vertical black dotted lines. The black squares represent the dominant lamellar phase (), the purple hexagonal symbols represent the inverse hexagonal phase (), and the red squares represent the dense lamellar phase () for all ion types. The additional lamellar phase in the presence of 2 and 15 wt% MBP are denoted as dMBP (half-filled orange squares).

