Fig. 4.
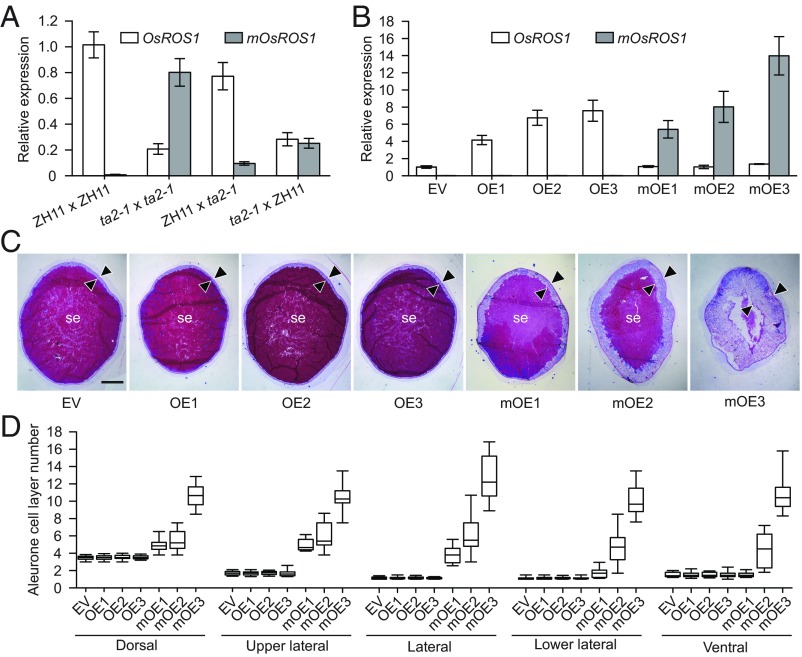
The presence of mOsROS1 led to the ta phenotype. (A) qRT-PCR showing the relative abundance of OsROS1 and mOsROS1 transcripts in 9-DAP endosperms produced in crosses between ZH11 and ta2-1, with the female parent written first. Values are plotted relative to the expression of OsROS1 in endosperms of ZH11 × ZH11, which was set to 1. Data are shown as mean ± SD (n = 3). (B) Relative OsROS1 and mOsROS1 transcript levels in 9-DAP endosperms in transgenic plants carrying an empty vector (EV), pUbi::OsROS1 (lines OE1–OE3), or pUbi::mOsROS1 (lines mOE1–mOE3). Values are plotted relative to the expression of OsROS1 in transgenic lines carrying an EV, which was set to 1. Data are shown as mean ± SD (n = 3). (C) Endosperm phenotypes of EV, OE, and mOE plants. Arrowheads indicate the aleurone. se, starchy endosperm. (Scale bar: 0.5 mm.) (D) Average numbers of aleurone cell layers, calculated in 20-cell file regions at different positions of endosperms in EV, OE, and mOE plants (n = 15).

