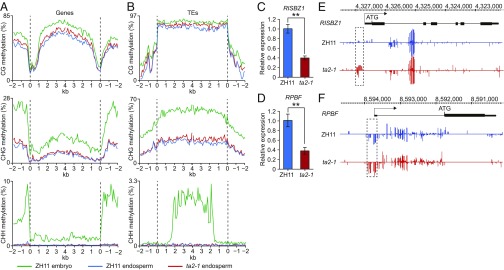
Fig. 5.
Altered DNA methylation and gene expression in ta2-1 endosperms revealed by WGBS. (A and B) Distribution of DNA methylation levels along gene bodies (A) and TEs (B) in embryos and endosperms of ZH11 and ta2-1 at 9 DAP. (C and D) Reduced expression levels of RISBZ1 (C) and RPBF (D) in ta2-1 9-DAP endosperms revealed by qRT-PCR. Data are shown as mean ± SD (n = 3). **Significant differences from ZH11 at the 0.01 level according to Student’s t test. (E and F) Snapshots in the Integrated Genome Browser showing DNA methylation levels in the RISBZ1 (E) and RPBF (F) of ZH11 and ta2-1 endosperms at 9 DAP. Dashed frames indicate the hypermethylated regions in ta2-1.

