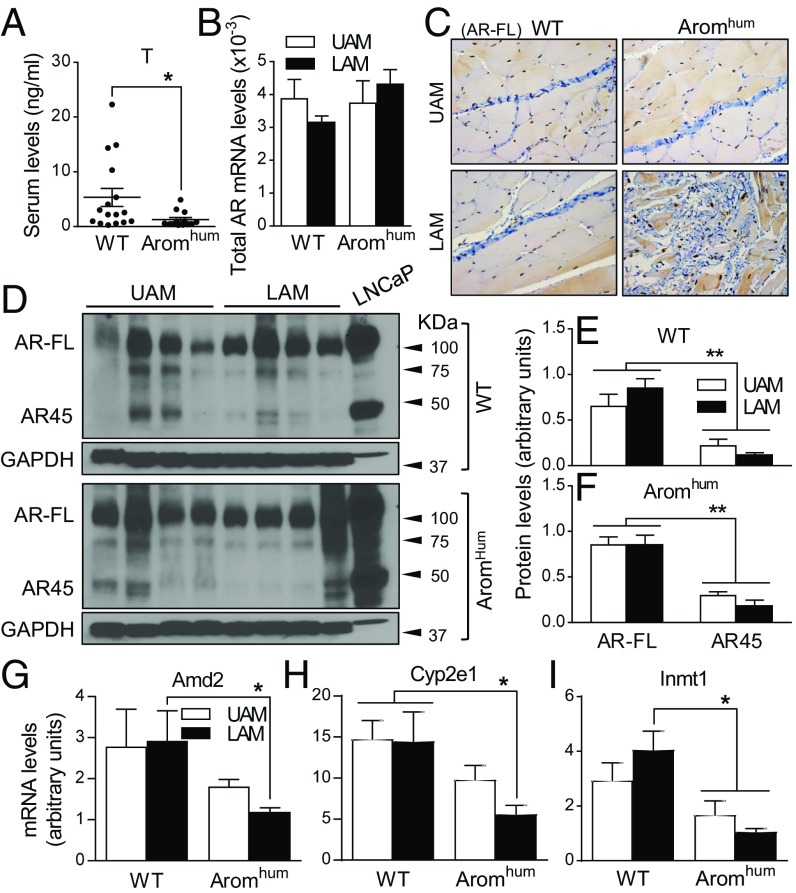
Fig. 6.
Androgen action is lower in LAM of Aromhum mice. (A) Serum T levels in WT and Aromhum mice were measured by radioimmunoassay. Mouse sera were collected from 26-wk-old mice. Two-tailed Student’s t test, *P < 0.05, n = 15. (B) Total AR mRNA levels (AR-FL and AR45) in UAM and LAM tissues of WT and Aromhum mice. Two-way ANOVA with Tukey’s multiple comparison test, n = 10. (C) Nuclear AR-FL assessed by IHC in UAM and LAM of WT and Aromhum mice. n = 8. (Scale bar, 50 μm; Magnification: C, 40×.) (D) AR-FL and AR45 protein levels in UAM and LAM tissues of WT and Aromhum mice. GAPDH protein levels served as the loading control. Human prostate cancer cell line LNCaP served as AR-FL and AR45 positive controls. Quantification of AR-FL and AR45 by densitometry in UAM and LAM of WT (E) and Aromhum (F) mice. Two-way ANOVA with Sidak’s multiple comparison test, **P < 0.01, n = 4 mice in each group. mRNA levels of androgen-responsive genes Amd2 (G), Cyp2e1(H), and Inmt1 (I) in UAM and LAM tissues of WT and Aromhum mice. GAPDH mRNA levels served as the control. Two-way ANOVA with Tukey’s multiple comparison test, *P < 0.05, n = 10 mice per group.

