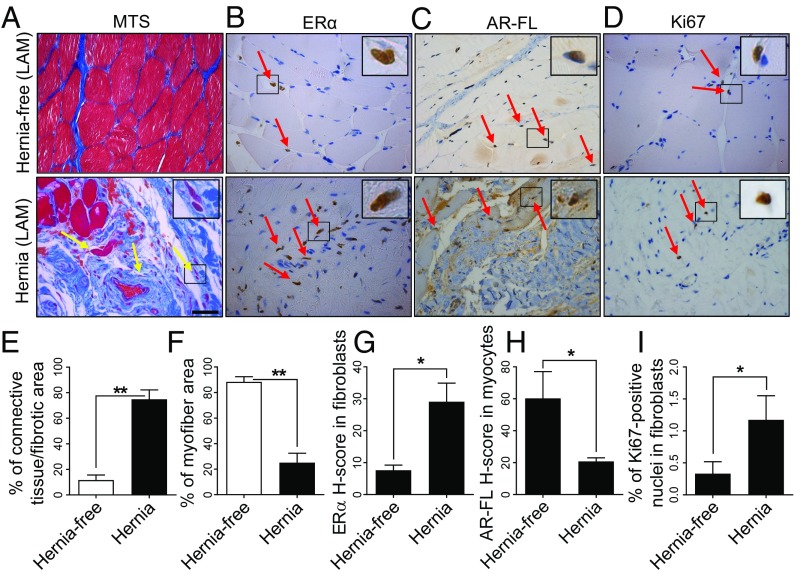
Fig. 7.
(A) Masson’s trichrome staining (MTS), (B) immunostaining for ERα, (C) AR-FL, and (D) Ki67 in LAM tissue from hernia-free and hernia patients. Yellow arrows indicate atrophic myocytes. Red arrows indicate brown positive staining. (Scale bar, 50 μm; Magnification: Insets in A–D, 40×.) Quantification of the percentage of connective tissue or fibrotic area (E) and myofiber area (F), the average H-score (range 0–300) for ERα in fibroblasts (G) and AR-FL in myocytes (H), and the percentage of Ki67+ nuclei (I) in fibroblasts from hernia-free and hernia patients. Two-tailed Student’s t test, *P < 0.05, **P < 0.01, n = 6 per group.

