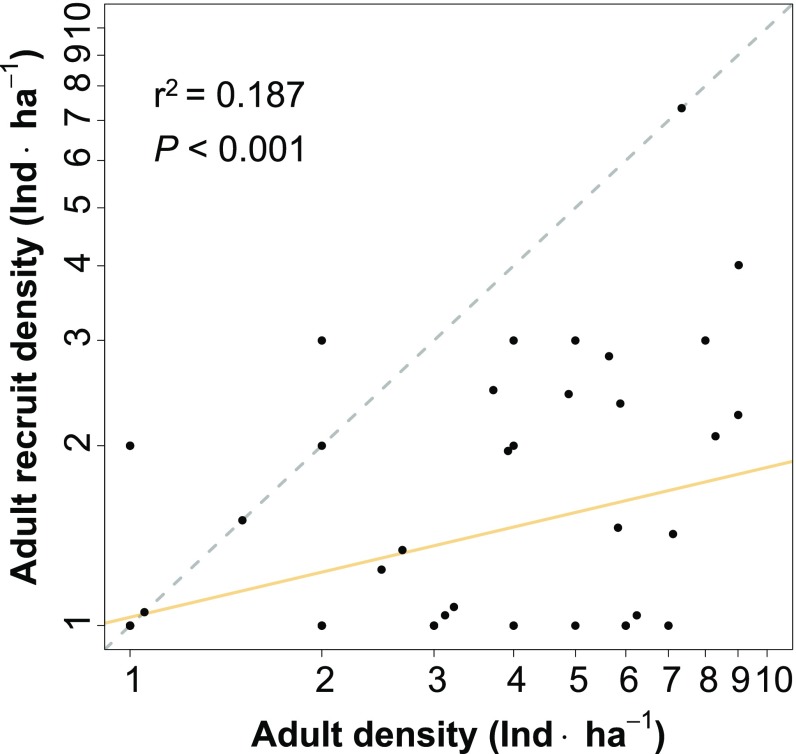
Fig. 2.
The relationship between adult density and adult recruit density in H. guayacan. The axes are on a logarithmic scale (base 10). The dashed gray line is the one-to-one (density-independent) relationship. The slope of the relationship between adult density and adult recruit density is 0.25 and significantly <1. This indicates that adult recruitment is negatively density dependent.

