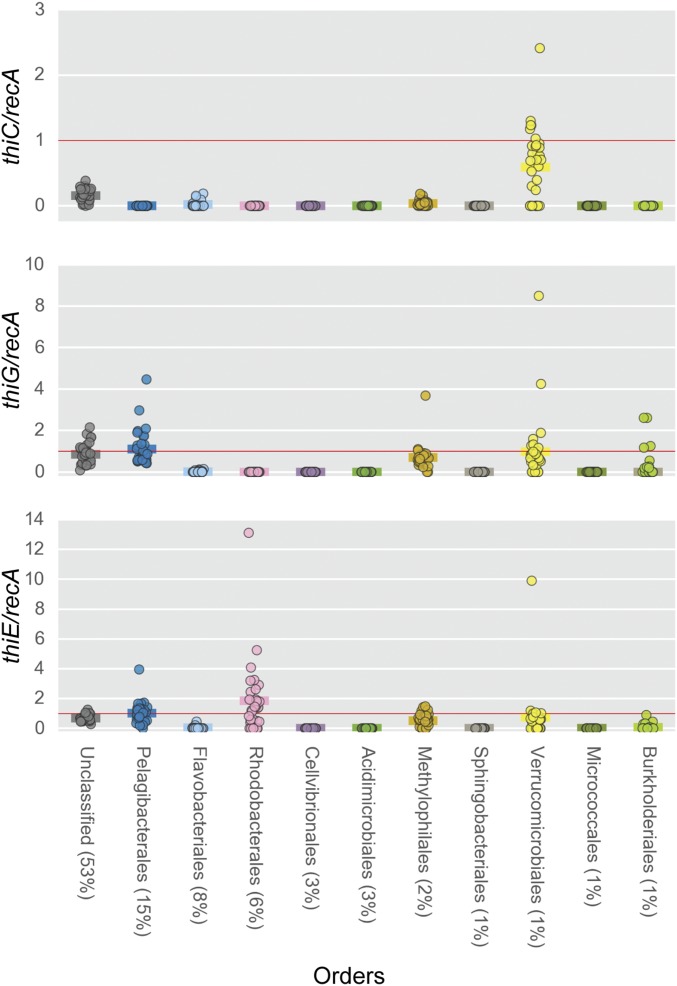
Fig. 2.
recA-normalized abundances of B1 biosynthesis genes (thiC, thiG, thiE) for the most abundant bacterioplankton taxa across LMO metagenomes (based on the mean percentage of total prokaryotic sequences). Genes classifiable at the class level but not at the order level are in the unclassified category. Solid horizontal lines belonging to each order represent average abundance values.

