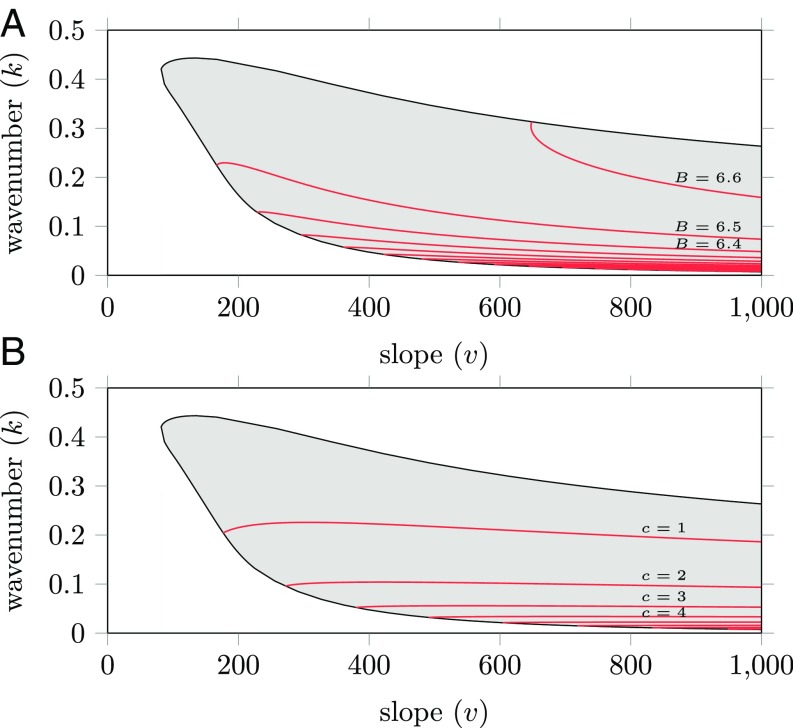
Fig. 2.
(A and B) (Slope, wavenumber)-Busse balloon slices for the extended-Klausmeier model that include contours for the total biomass (per area) (A) and the migration speed (B). Biomass (per area) is positively correlated with both wavenumber and slope ; the migration speed is negatively correlated with the wavenumber . Model parameters used: , , .

