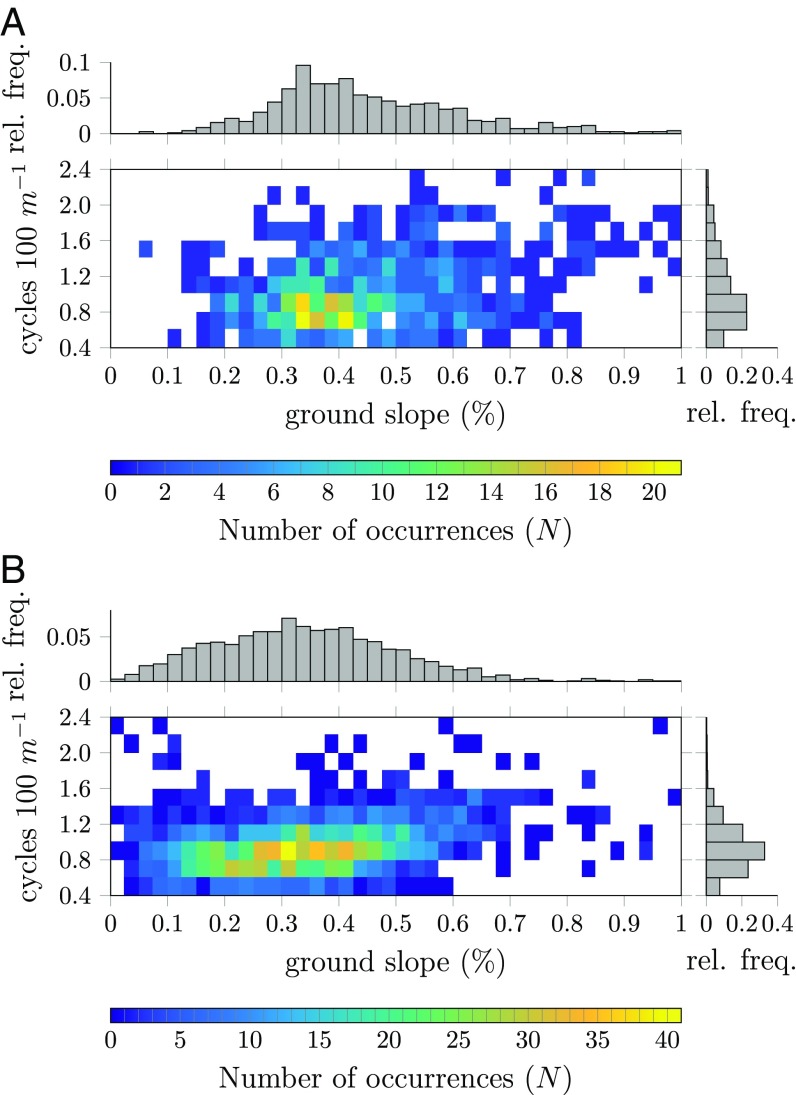
Fig. 3.
(A and B) Frequency distribution of banded patterns as function of ground slope and wavenumber (number of cycles per 100 m) for the Haud site (A) and the Sool site (B). The distribution on the right indicates the relative frequency of banded vegetation with corresponding wavenumber. The color gradient indicates the amount of windows ().

