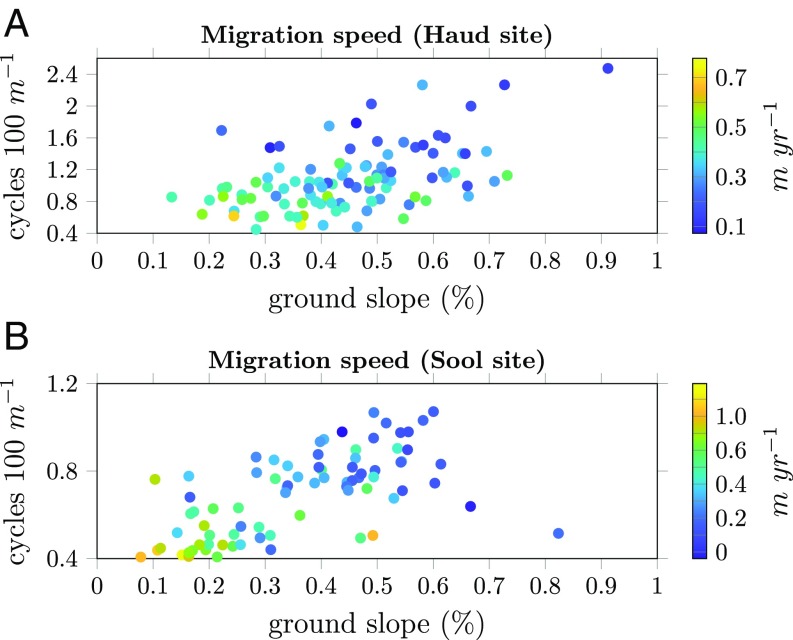
Fig. 5.
(A and B) Observed (average) migration speed of vegetation bands in the Haud (A) and Sool (B) sites over the course of 39 y as a function of ground slope and wavenumber (cycles per 100 m). The color gradient indicates the migration speed for a particular (slope, wavenumber) combination. The sign indicates the direction of migration relative to the slope, with positive and negative values indicating upslope and downslope migration, respectively.

