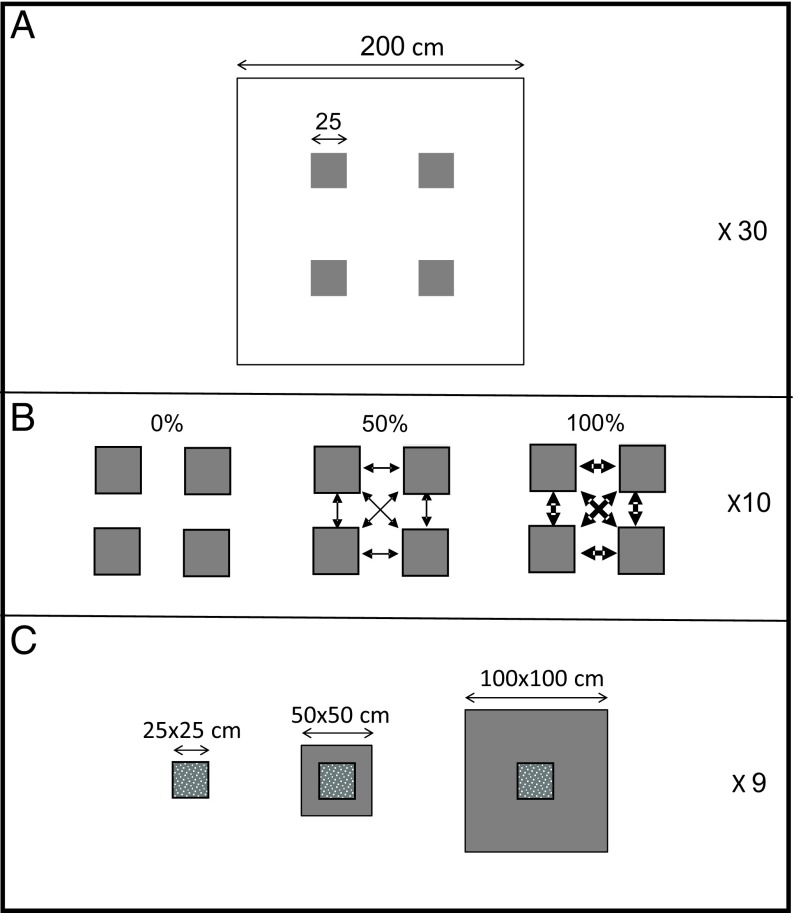
Fig. 1.
Schematic illustration of the experimental design. (A) A single metacommunity in the field experiment showing the arrangement of the four local communities. (B) A set of metacommunities in the field experiment showing the three dispersal treatments. Arrow weights indicate the level of dispersal. (C) Design of the mesocosm experiment showing containers of different sizes, with the focal communities marked by dots. Values on the right indicate the number of replicates.

