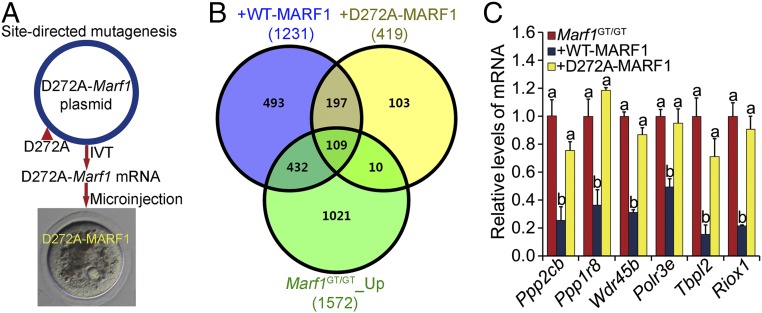
Fig. 3.
(A) Schematic illustration of the experimental design for the analysis of the RNase activity of MARF1 in oocytes by mutating the conserved D272 residue in the NYN domain to alanine. IVT, in vitro transcription. (B) Venn diagram illustrating the relationship of the transcripts down-regulated by supplementation with either WT MARF1 (+WT-MARF1) or D272A-mutant MARF1 (+D272A-MARF1) in Marf1GT/GT oocytes with those up-regulated in Marf1GT/GT oocytes (Marf1GT/GT_Up) compared with WT mouse oocytes. (C) Real-time RT-PCR validation of representative transcripts down-regulated by supplementation with WT but not D272A-mutant MARF1 in Marf1GT/GT oocytes. Fold changes relative to the Marf1GT/GT group are shown as mean ± SEM (n = 3). Different letters indicate a significant difference, P < 0.05, by one-way ANOVA and Tukey’s HSD test.

