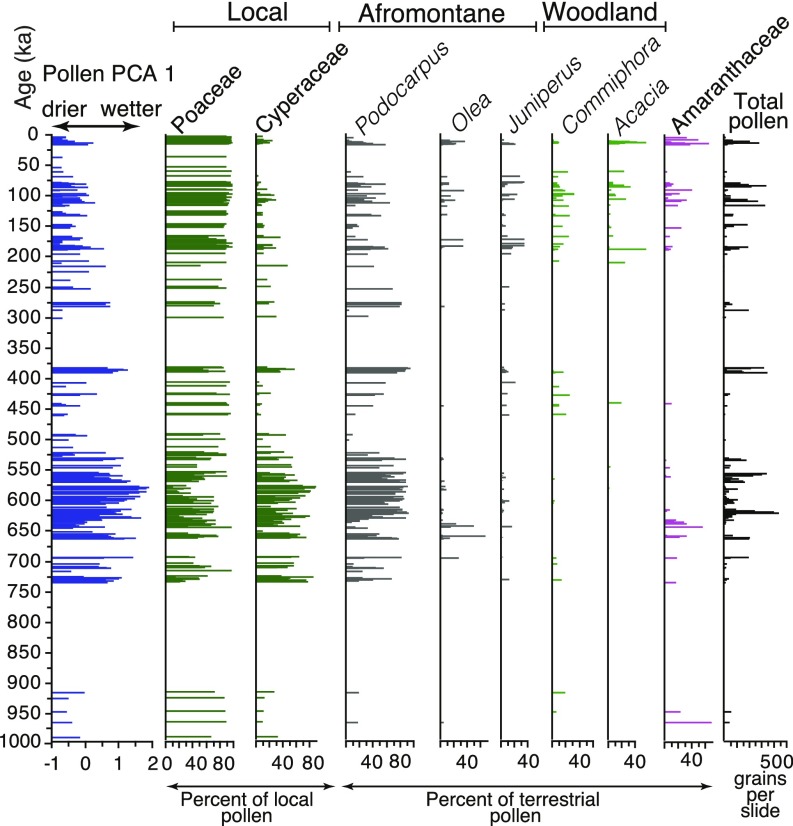
Fig. 4.
Pollen stratigraphy. Selected taxa are shown. Pollen PCA 1 summarizes all pollen data and shows a long-term reduction in PCA values from ∼575 ka that reflects increased aridity. Poaceae increases upward, with Cyperaceae and Podocarpus declining. Other taxa suggest increasing aridity during the last half million years.

