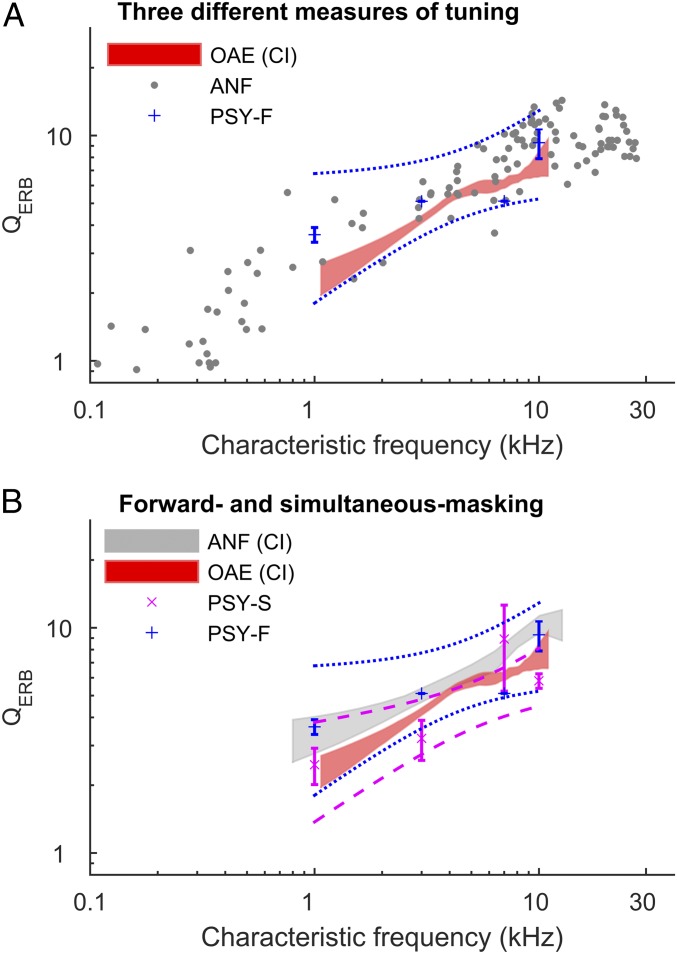
Fig. 2.
Three measures of frequency selectivity agree. (A) Filter sharpness from PSY-F agrees closely with ANF and OAE measurements. Tuning in individual nerve fibers (gray points), psychophysical forward masking (blue points), and a loess trend and its bootstrapped 95% CI for the otoacoustic emissions measurements. Dashed lines indicate bootstrapped 95% CIs for the data. (B) Forward masking (PSY-F; blue points, n = 8) yields a better match to auditory nerve tuning than simultaneous masking (PSY-S; magenta points, n = 22). In B, auditory nerve data are shown as the area within the loess (SI Appendix, Experimental Methods) trend 95% CI. ANF data from ref. 27.

