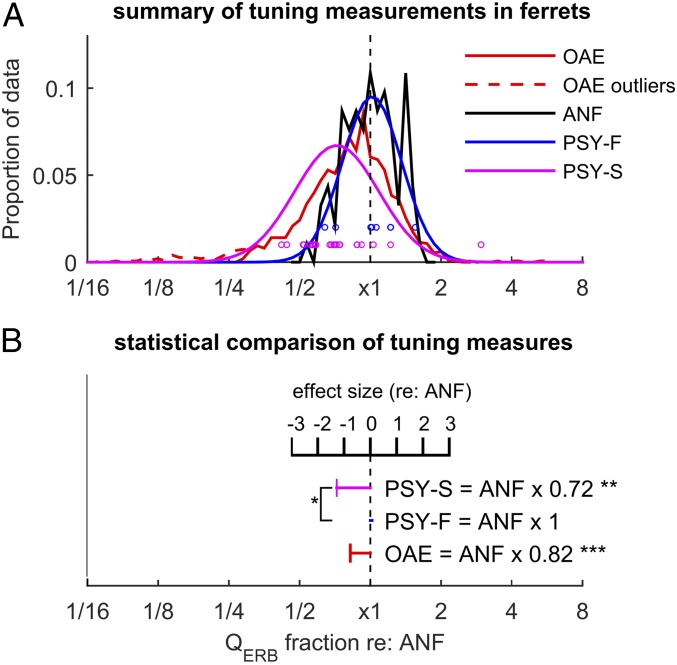
Fig. 3.
Comparing different measures of frequency resolution in the ferret, independently of the effect of signal frequency. (A) The different tuning measurements as a fraction of the mean ANF tuning at a given frequency. Dashed red lines show excluded OAE outliers (see SI Appendix, Experimental Methods). (B) Statistical comparison of the different measures of tuning. Horizontal bars show the mean of each measure as a fraction of auditory nerve tuning and also as effect size (relative to ANF tuning). Asterisks next to data points indicate significant differences compared with auditory nerve tuning. *P < 0.05; **P < 0.01; ***P < 0.001.

