Fig. 3.
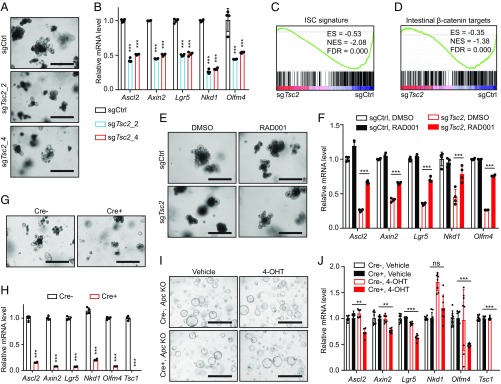
Activation of mTORC1 signaling impairs Wnt signaling and stem cell functions in intestinal organoids. (A) Morphology of control or TSC2-deleted intestinal organoids cultured for 4 d. (B) Quantitative RT-PCR analysis of relative mRNA levels of Wnt/β-catenin target genes and intestinal stem cell marker genes in organoids described in A. n = 4. (C and D) GSEA of the ISC gene signature (C) and intestine-specific β-catenin target gene sets (D) in TSC2-deleted versus control organoids. (E) Morphology of control or TSC2-deleted organoids cultured in the presence of DMSO or 50 nM RAD001 for 5 d. (F) Quantitative RT-PCR analysis of relative mRNA levels of Wnt/β-catenin target genes and intestinal stem cell marker genes in organoids described in E. n = 4. (G) Morphology of Tsc1fl/fl (Cre−) or Tsc1fl/fl; Rosa26-CreER (Cre+) organoids cultured in the presence of 1 µM 4-OHT for 4 d. (H) Quantitative RT-PCR analysis of relative mRNA levels of Wnt/β-catenin target genes, intestinal stem cell marker genes, and Tsc1 gene in organoids described in G. n = 4. (I) Morphology of APC-deleted Tsc1fl/fl (Cre−) or Tsc1fl/fl; Rosa26-CreER (Cre+) organoids cultured in the presence of vehicle or 1 µM 4-OHT for 4 d. (J) Quantitative RT-PCR analysis of relative mRNA levels of Wnt/β-catenin target genes, intestinal stem cell marker genes, and Tsc1 gene in APC-deleted Tsc1fl/fl (Cre−) or Tsc1fl/fl; Rosa26-CreER (Cre+) organoids cultured in the presence of vehicle or 1 µM 4-OHT for 4 d. n = 8. Data shown as mean ± SD (B, F, H, and J); significance tested using two-tailed t test (B and H) and ANOVA (F and J); **P < 0.01, ***P < 0.001; ns, not significant. [Scale bars: 200 µm (A and E), 400 µm (G), and 1,000 µm (I).] ES, enrichment score; FDR, false discovery rate; NES, normalized enrichment score.

