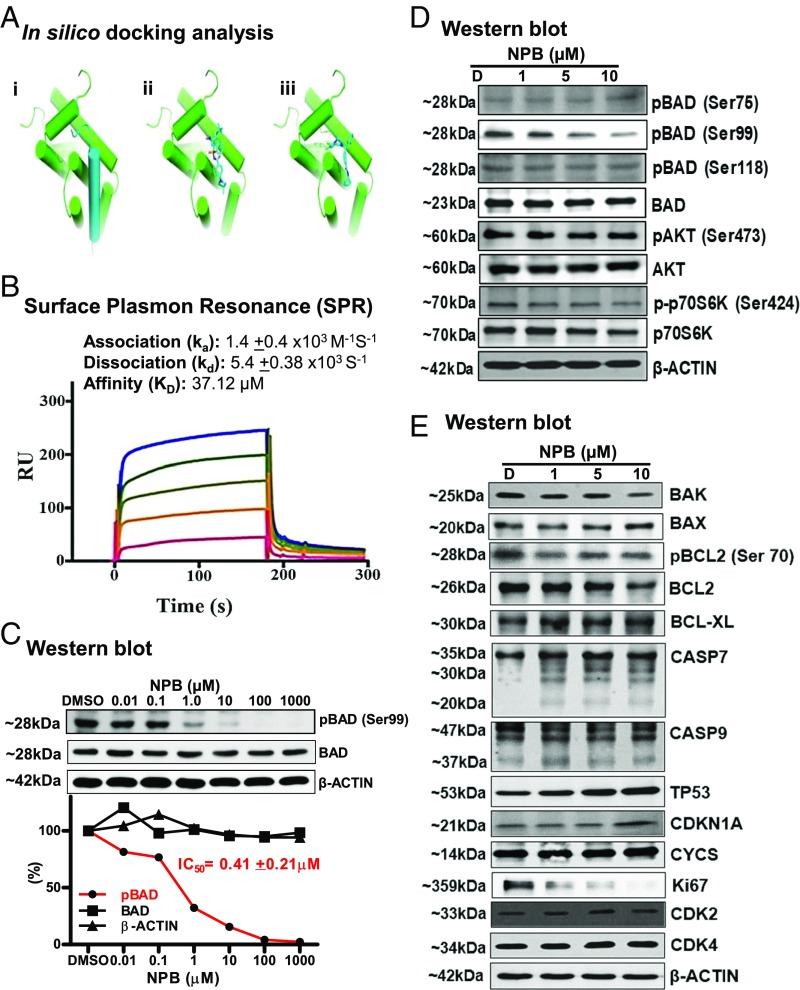
Fig. 4.
Cheminformatics and SPR analysis predict an interaction of NPB with BAD protein. (A) Docking studies of NPB toward the Bcl-2/BAD interface. (i) Modeled complex of Bcl-2 (green cartoon) and a 25-residue helical fragment of BAD (blue cartoon) based on the structures of Protein Data Bank ID code 2O22 and 1G5J (70, 74). (ii) NMR-derived structure of a small molecule [(4-(4,4-Dimethylpiperidin-1yl)-N-(4-(2-methyl-1-(phenylthio)-propan-2-ylamino)-3-nitrophenylsulfonyl) benzamide] in stick representation binding to a groove within the protein–protein interface of Bcl-2 (70). (iii) Predicted binding mode of NPB to Bcl-2: NPB occupies a binding region similar to that of a known Bcl-2 binder but additionally exploits a hydrophobic pocket formed by Leu94, Trp141, and Phe195 (in mouse) (shown as lines) in the BCL-2/BAD interface. (B) Sensorgrams obtained by SPR analysis of NPB with the BAD protein subunit. The BAD protein subunit was immobilized on the surface of a CM5 sensor chip. A solution of NPB at variable concentrations (20–100 µM) was injected to generate the binding responses (RU) recorded as a function of time (s). The results were analyzed using BIA evaluation 4.1. (C, Upper) WB analysis was used to assess the level of BAD phosphorylation at Ser99 in MCF7 cells after treatment with NPB. (Lower) IC50 of NPB calculated from the dose–response curves for BAD phosphorylation at Ser99, BAD, and β-actin using ImageJ software (NIH) (https://imagej.nih.gov/ij/). (D) WB analysis was used to assess the level of multiple proteins upstream of BAD in MCF7 cells after treatment with NPB. (E) WB analysis was used to assess the level of multiple proteins involved in cell survival and cell proliferation in MCF7 cells after treatment with NPB. β-Actin was used as an input control for cell lysate. The sizes of detected protein bands are shown on the left. For WB analysis, soluble whole-cell extracts (30 µg for C and 50 µg for D and E) were run on an SDS/PAGE gel and were immunoblotted as described in Materials and Methods.

