Fig. 3.
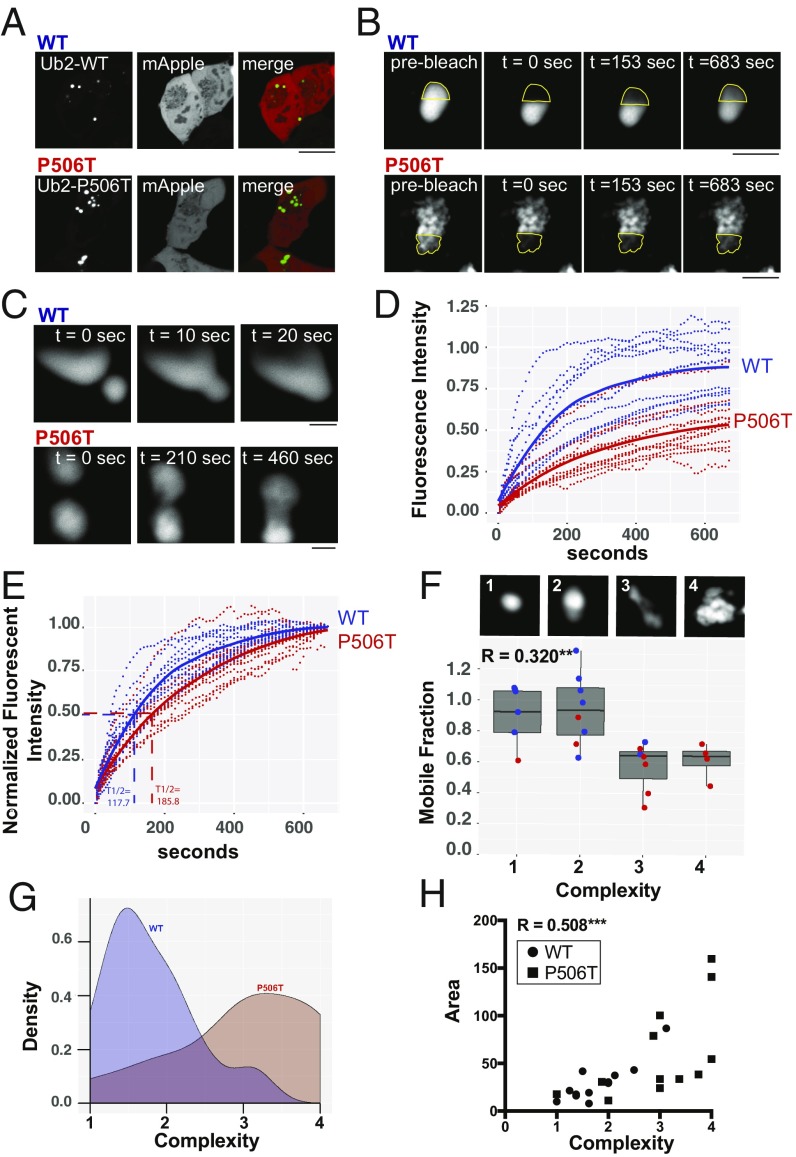
In vivo FRAP demonstrates that WT-UBQLN2 puncta are more liquid-like and structurally less complex that P506T-UBQLN2 puncta. (A) Representative images of HEK293 cells transfected to express WT (Upper) or P506T (Lower) UBQLN2 together with mApple. Intracellular puncta were selected for FRAP analysis as in B and C and Movies S1 and S2. (Scale bar, 10 μM.) (B) Representative high-magnification images of UBQLN2 puncta from two FRAP experiments. Time points are shown before photobleach, immediately after photobleach, at time to half-maximal recovery (t 1/2 max), and at the end of the 10-min recovery period. Dotted outline shows the photobleached area. (Scale bars, 2 μM.) (C) Images showing fusion of two WT (Upper) or P506T (Lower) UBQLN2 puncta. (Scale bars, 2 μM.) (D) Time course and maximum recovery for individual puncta following photobleaching (dotted lines; WT, blue and P506T, red). Mean recovery curves for WT and P506T are shown with solid lines. (E) As in D, except that the extent of recovery (mobile fraction) has been normalized to highlight differences in the rate of recovery between WT- and P506T-UBQLN2. Average t 1/2 max is shown for both. (F) Box plot depicting strong correlation between mobile fraction and puncta complexity (R2 = 0.320; **P ≤ 0.01). Images (Upper) show representative puncta for each complexity score 1–4 (imaged at 100× with 10× digital zoom). Dots show each individual values for WT (blue) or P506T (red) puncta. An average complexity score for each punctum was calculated by combining ratings from a panel of eight scorers blinded to UBQLN2 genotype. (G) Density plot showing the distribution of complexity scores for WT and P506T UBQLN2 puncta. The WT and P506T population distributions differ significantly from each other based on the Kolmogorov–Smirnov test (D = 0.66667, ***P value < 0.01). (H) Graph showing a significant correlation between puncta area and complexity (R2 = 0.508, ***P ≤ 0.001). Circles and squares depict values for WT- and P506T-UBQLN2 puncta, respectively.

