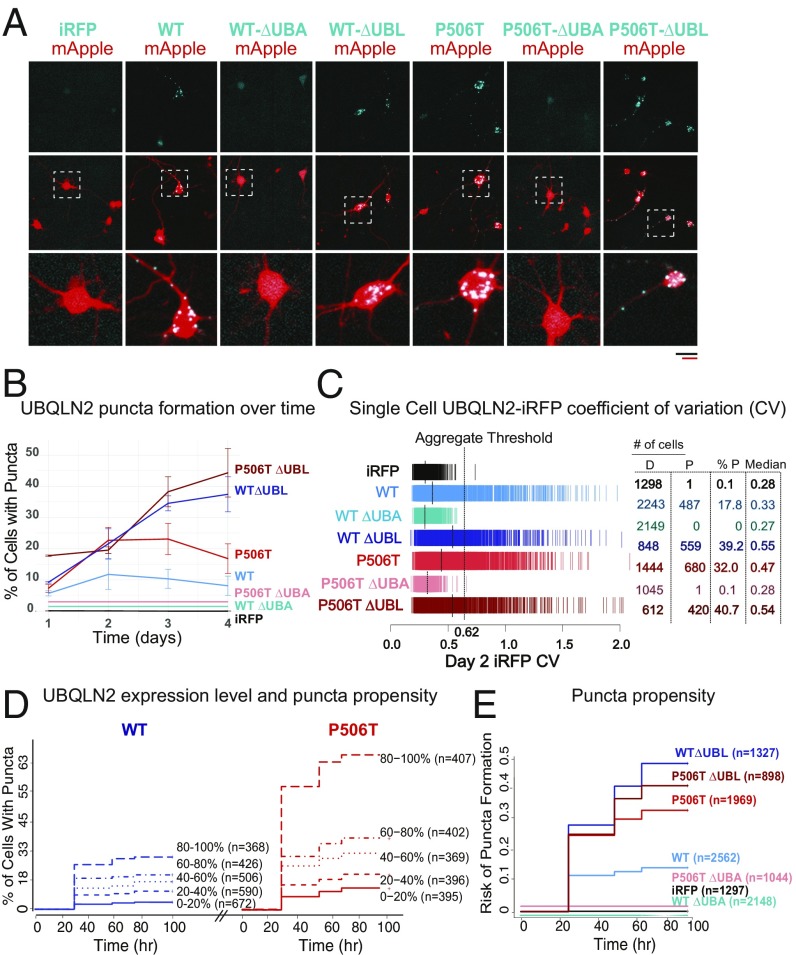
Fig. 5.
Serial imaging of neurons by automated fluorescence microscopy demonstrates increased puncta formation by the P506T mutation in neurons. (A) Neurons were cotransfected at day in vitro 4 with the indicated UBQLN2-iRFP plasmids (blue) together with mApple (red) as a morphology marker, then imaged 48 h later. Both WT-UBQLN2 and P506T-UBQLN2 form puncta in neurons, whereas UBQLN2 lacking the UBA domain remains diffuse. (Scale bars, black is for Upper two rows and red scale bar for Lower Inset, both 50 µm.) Neurons within checkered boxes are enlarged in Bottom row. (B) Plot representing percentage of neurons containing UBQLN2 puncta over time. A neuron was classified as containing puncta if it had an iRFP CV great than the aggregation threshold of 0.62. Only cells that lived for the duration of the 4 d of analysis were included. Error bars represent the SEM from three replicate experiments. Lines for iRFP, WT ∆UBA, and P506T ∆UBA are offset for visualization purposes but all equal 0. (C) Single-cell iRFP CV, a proxy for the extent of aggregation, measured 2 d after transfection. Each hash mark represents a single cell, and the dashed lines indicate the median CV value for a population. A CV of 0.62 was established as an effective aggregate threshold to differentiate neurons with visible aggregates from those with diffuse UBQLN2 (SI Appendix, Fig. S4). The number of cells with a CV value below (diffuse: D) or above (punctate: P) this threshold, as well as the median CV value for each population, are listed for each variant. (D) Percentage of neurons containing puncta with increasing UBQLN2 expression levels. Neurons within the groups WT-UBQLN2 (blue) and P506T-UBQLN2 (red) were divided into quintiles based on day 1 expression level (iRFP intensity) and plotted on a cumulative hazard plot with the y axis representing the percentage of neurons containing aggregates. Hazard ratios are reported in SI Appendix, Table S1. Neurons are pooled from three replicate experiments. Both plots share the same y axis. (E) The relative risk of puncta formation was compared between groups. Cells from three replicate experiments were rank-ordered by day 1 iRFP intensity, then divided into quintiles. For Cox proportional hazards analysis, cells were stratified by day 1 expression quintile to minimize the effects of differential expression between genotypes. Only cells that lived the duration of analysis (4 d) were included. Hazard ratios are reported in SI Appendix, Table S2.

