Fig. 6.
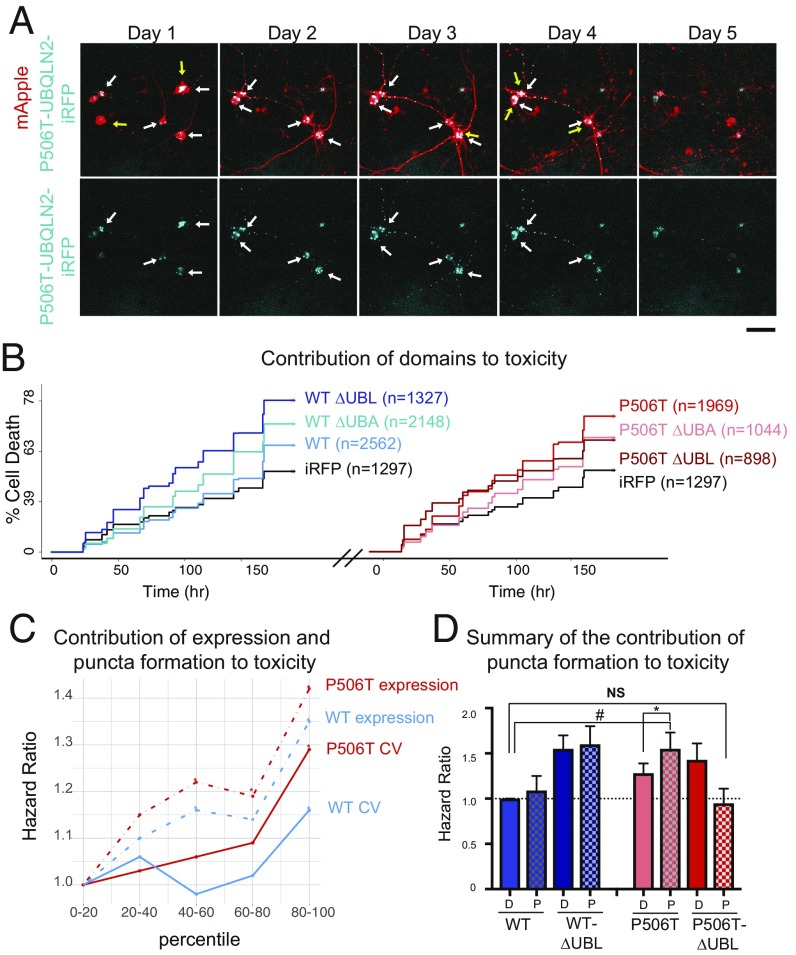
Increased propensity of UBQLN2 to form puncta correlates with neuronal toxicity. (A) To assess survival, transfected neurons expressing iRFP-tagged P506T-UBQLN2 (blue) and mApple (red) were imaged daily and the last time a cell was seen alive (yellow arrows) was recorded as time of death. Neurons expressing iRFP-P506T-UBQLN2 form aggregates (white arrows). (Upper) Merged images; (lower) only iRFP-P506T-UBQLN2. (Scale bar, 50 μm.) (B) Cumulative risk of death over time for neurons expressing WT-UBQLN2 or P506T-UBQLN2 as well as the corresponding UBA and UBL deletion mutants. Neurons in each group were pooled from three replicates, stratified by experiment date. Only neurons that lived to day 2 with diffuse UBQLN2 on day one were used for analysis, to keep the data consistent with subsequent analyses. Both plots share the same y axis. Hazard ratios are reported in SI Appendix, Table S3. (C) Dose-dependent toxicity is observed for both UBQLN2 expression and puncta formation. In neurons expressing WT- or P506T-UBQLN2, cells were rank-ordered by day 1 expression and degree of punctateness (CV), then divided into quintiles. For each genotype the relative toxicity (hazard ratio) for each quintile was compared with its lowest quintile. Solid lines = CV, dashed lines = expression, *P < 0.05 by Cox proportional hazards analysis. Hazard ratios and significance values for all groups are reported in SI Appendix, Table S4. (D) Puncta formation by UBQLN2-P506T enhances toxicity. For neurons expressing WT- or P506T-UBQLN2 and their UBL domain deletion mutants, cells were stratified into two groups: diffuse or punctate (D or P) UBQLN2 on day 2 after transfection. Cells that formed inclusions by day 1 were excluded to ensure that only cells in which the inclusion formation was observed were included. Cells also were rank-ordered by day 1 expression levels, then separated into quintiles. Cox proportional hazards analysis was performed stratifying by expression quintile to ensure that cells with comparable expression were compared (hazard ratios and significance values are reported in SI Appendix, Table S7) (*P < 0.01, #P < 0.0001, NS, not significant).

