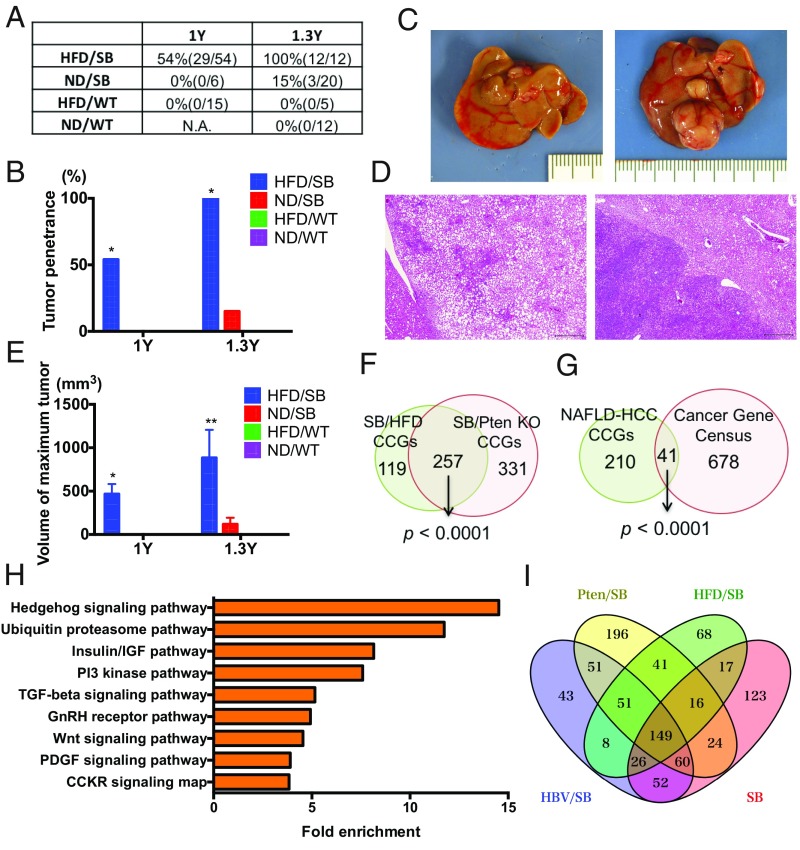
Fig. 2.
SB mutagenesis significantly accelerates NAFLD-HCC in HFD-fed mice. (A and B) Tumor penetrance of normal diet (ND)-fed WT, HFD-fed WT, ND-fed SB, and HFD-fed SB mice at 1 and 1.3 y of age. The numbers of mice that have tumors compared with the numbers of mice analyzed, are listed in brackets. *P < 0.05 vs. all. (C) Gross pictures of the livers from a HFD-fed WT mouse (Left) and a HFD-fed SB mouse (Right) at 1 y of age. (D) H&E staining of liver tumors from a HFD-fed SB mouse. (Scale bar: 500 μm.) (E) Maximum tumor volume per animal observed in male ND-fed WT, HFD-fed WT, ND-fed SB, and HFD-fed SB mice at 1 and 1.3 y of age (*P < 0.05 vs. HFD/WT, **P < 0.05 vs. all; data are provided as mean ± SEM). (F) Venn diagram comparing the list of CCGs obtained from SB mutagenesis screens of PtenKO and HFD-fed mice. (G) Venn diagram comparing the list of human orthologs of common CCGs obtained from NAFLD-HCC SB mutagenesis screens and known human cancer genes found in the Cancer Gene Census database (15). (H) Pathway analysis performed with PANTHER. Enriched pathways among CCGs are shown along with the fold enrichment value. (I) Venn diagram comparing lists of CCGs obtained from four SB mutagenesis screens [PtenKO and HFD-fed mice in the current study, and HBV surface antigen transgenic (HBV/SB) and ND-fed mice (SB) in previous studies] (21, 22).

