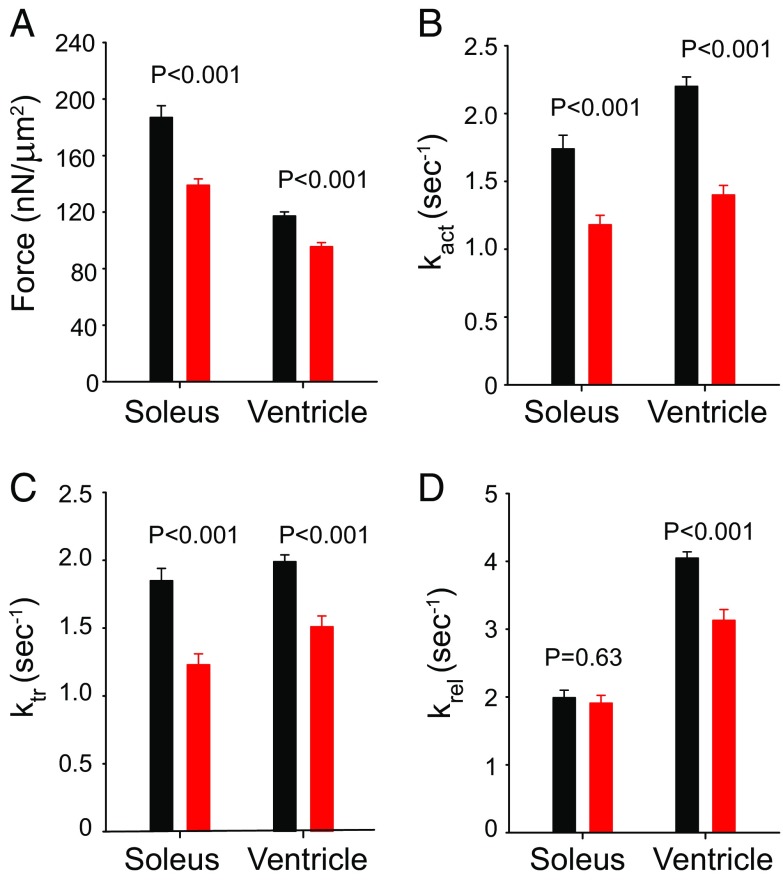
Fig. 6.
Mean values (±SEM) of (A) force, (B) kact, (C) ktr, and (D) krel obtained with soleus and ventricle myofibrils isolated from NTG (black) and TG (red) muscles. Statistical P values were obtained after t tests comparing the two groups of myofibrils in each condition. The sample sizes were as follows. Soleus: 8 NTG rabbits (63 experiments); 9 TG rabbits (68 experiments). Ventricles: 8 NTG rabbits (56 experiments); 9 TG rabbits (71 experiments). Details are in SI Appendix, Table S2.

