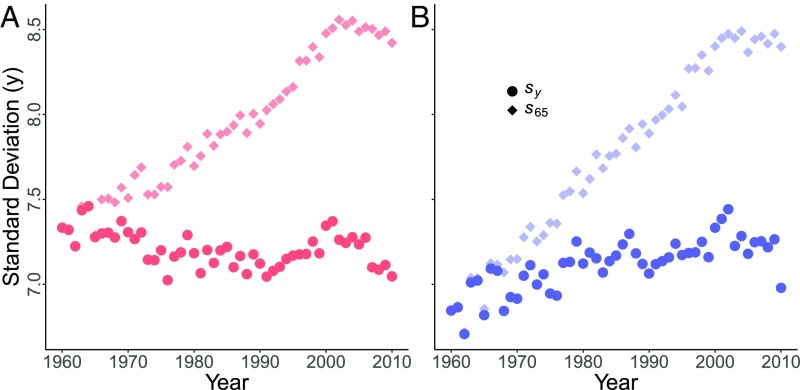
Fig. 4.
(A and B) Vertical axis: variability (measured by SD of age at death) for deaths past age 65 y (diamonds) or a moving age (circles). Horizontal axis: year from 1960 to 2010. (A) Japanese females, red. (B) Japanese males, blue. Diamonds show rapid increase of . For each year , moving age , with the long-term speed of the survival front. Circles show variability .

