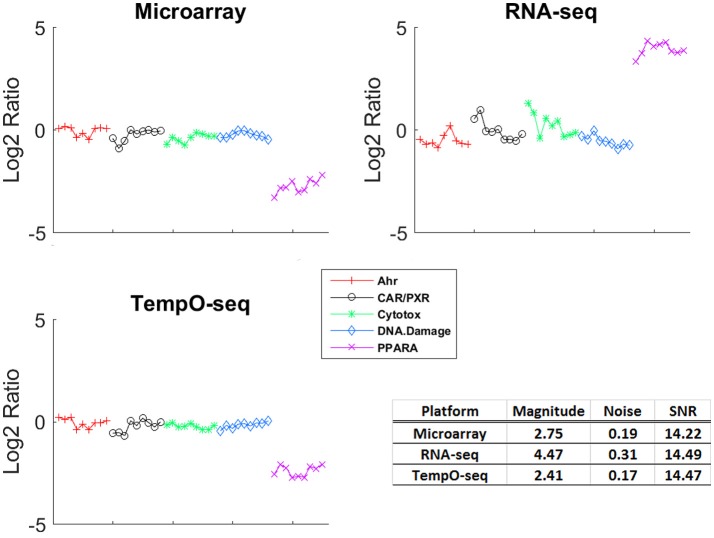
Figure 3.
Gene expression patterns with maximal signal to noise. For each platform, the EPIG pattern with the maximal signal to noise ratio (SNR) is shown. The y-axis is the log2 ratio of gene expression (treated to the average of the control [matched according to nutritional status of the vehicle]), the x-axis is the samples grouped by MOA (represented by the colors and symbols in the legend). The table inset displays the magnitude of fold change, the noise and the SNR for each of the patterns shown.

