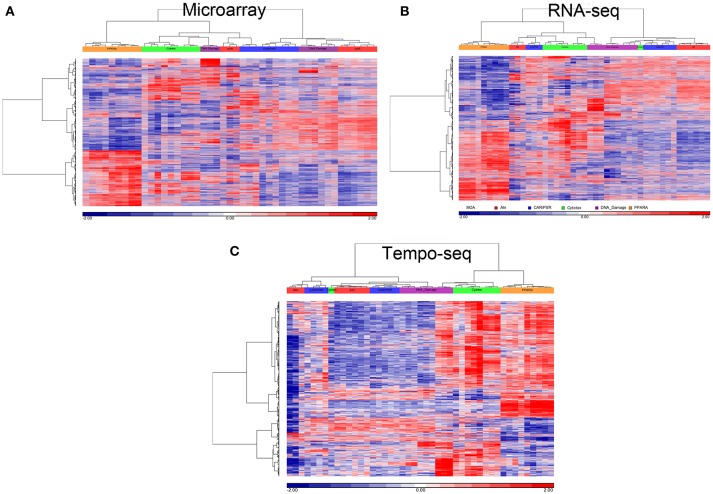
Figure 5.
Clustering of data. (A) Microarray. (B) RNA-Seq. (C) TempO-Seq. Clustering performed using the log2 ratio expression data (treated to matched control according to nutritional status) of the genes that vary by MOA at FDR < 0.01 with cosine correlation as the similarity metric and the Ward clustering criterion. The data for clustering was standardized to a mean of 0 and standard deviation of 1. Samples' MOA colored as in the legend to Figure 4A.

