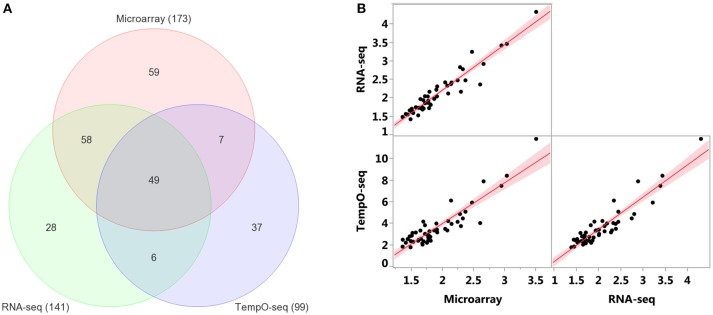
Figure 7.
Comparison of enriched GO biological processes (BPs). (A) Overlap of enriched GO BPs < FDR 5%. Minimum number of genes = 3 for TempO-Seq and 5 for the other two. (B) Pairwise comparison of GO BPs fold enrichment from the 49 categories in common between the three platforms. Red line is the linear fit (regression line) with 95% level confidence boundaries.

