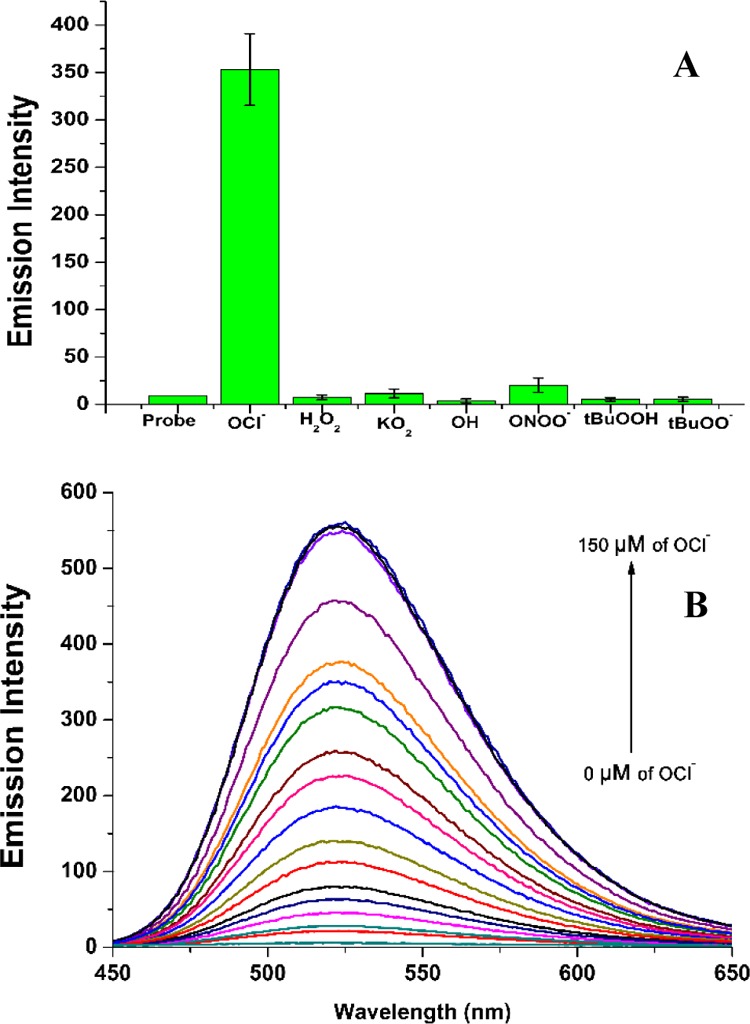
Figure 3.

[A] Bar graph depiction of fluorescence emission of Probe-OCl (15 μM) with NaOCl, H2O2, tBuOOH, O2•–, •OH, tBuO•, NO, and ONOO–. [B] Increase of emission spectra of Probe-OCl (15 μM) with various concentrations of NaOCl (0–150 μM) in solution (10 mM PBS, pH 7.4) incubated for 1.0 min. λex: 416 nm, λem: 523 nm. Slit width 3 nm/3 nm.
