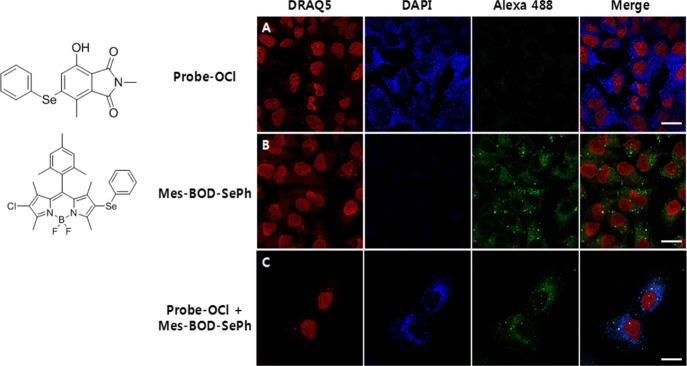
Figure 7.
Fluorescence imaging in live U-2 OS cells labeled with Probe-OCl and Mes-BOD-SePh [A]. Cells were incubated for 10 min with 25 μM Probe-OCl (blue, Ex/Em 405/500) in PBS [B] and 25 μM Mes-BOD-SePh (green, Ex/Em 488/530) [C] and coincubated for 10 min. Probe-OCl signals were consistent with LD staining dye MES-BOD-SePh. Scale bar, 10 μm.

