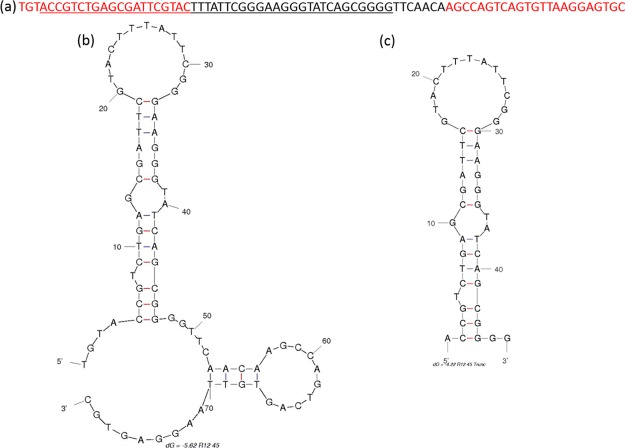
Figure 3.
(a) Full sequence of the R12.45 candidate aptamer. Red color represents the constant regions and the underlined region represents the truncated region. (b) Secondary structure of the full R12.45 candidate aptamer predicted by Mfold.23 (c) Secondary structure of the R12.45 truncated candidate aptamer predicted by Mfold.23 Images are from free domain and are specific for the given sequences and binding condition.

