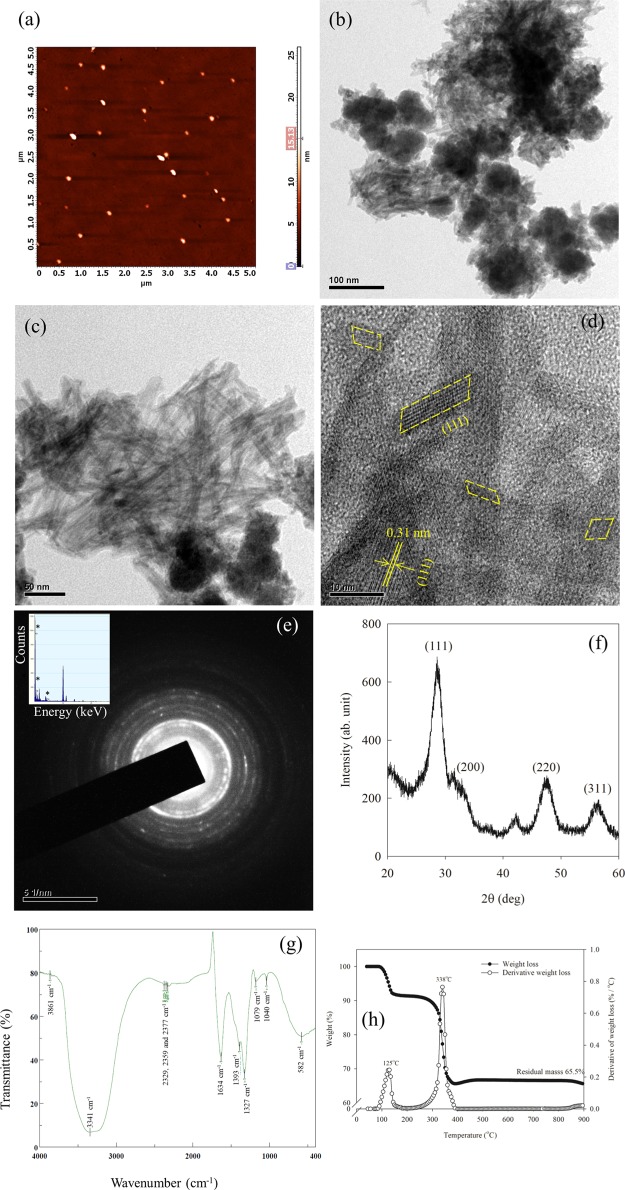
Figure 1.
Representative (a) AFM, (b) TEM, (c,d) HRTEM, (e) SAED, the insert showing the EDX analysis, (f) powder XRD pattern, (g) FT-IR, and (h) TGA image of synthesized nanoceria. (a) AFM image of nanoceria showing the particle size of 15 nm. (b) Low-resolution TEM image showing rod-shaped nanoceria. (c) HRTEM image showing rod-shaped nanoceria. (d) Cubic phase nanoceria with a d spacing of 0.31 nm. (e) SAED pattern confirms the presence of cubic shape and its inset showing the purity of synthesized nanoceria. (f) Cubic phase of nanoceria was identified by a strong peak of the (111) plane, which corresponds to the interplanar spacing of 0.31 nm. The sharpness of the diffraction peaks suggests that the product is well crystallized. (g) FT-IR spectrum of nanoceria showing four intense absorption bands at 3341, 1634, 1327, and 582 cm–1. (h) Complete weight loss at around 400 °C indicates the pure phase of CeO2.

