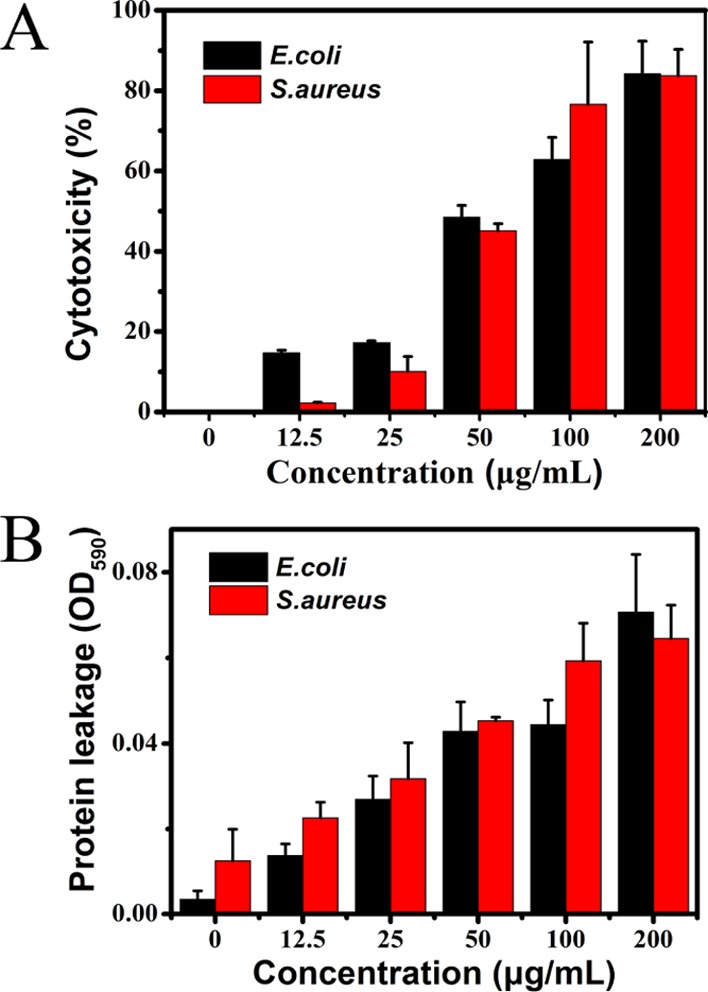
Figure 7.

(A) BQAS cytotoxicity measured by the LDH release from the bacterial cells after treatment with different concentrations (0–200 μg/mL) of BQAS for 3 h. (B) Release of protein from bacteria treated with BQAS (0–200 μg/mL). Bacterial cells (108 cfu/mL) incubated with 200 μL of different concentrations (0–200 μg/mL) of BQAS at 30 °C for 3 h at a shaking speed of 120 rpm. Error bars represent the standard deviation (n = 3).
