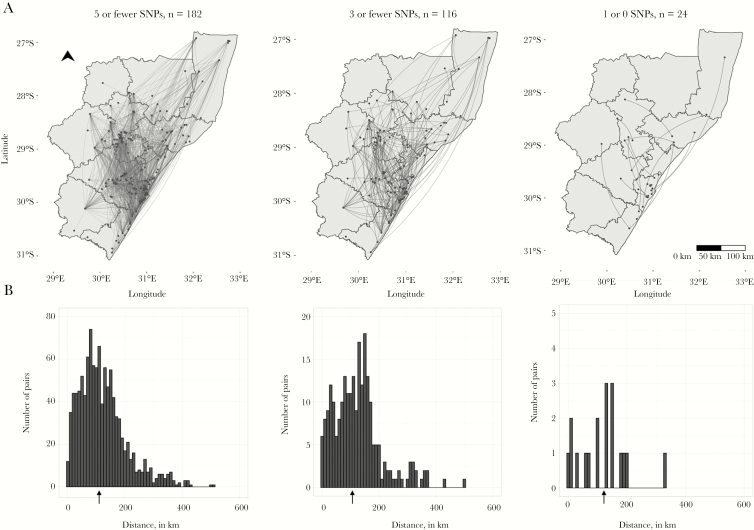
Figure 3.
A, Dots indicate home residences of XDR-tuberculosis cases; lines represent genomic links between cases. B, Arrows under histograms indicate the median distance between homes of genomically linked case-pairs at each SNP threshold. Note differences in the y axis range across plots. Abbreviation: SNP, single nucleotide polymorphism.

