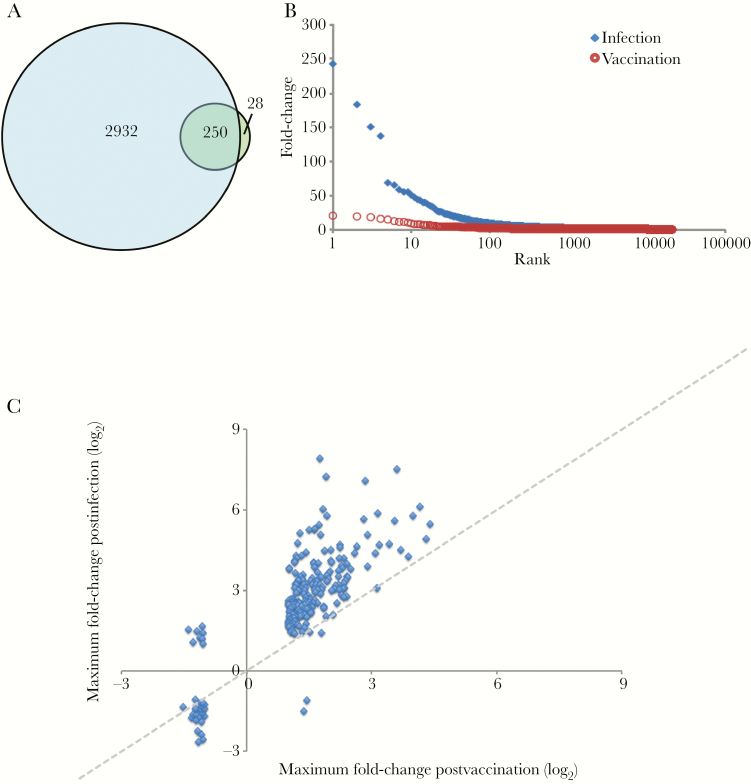
Figure 3.
Comparison of postvaccination and postinfection transcript abundance changes. A, Transcripts with significant changes on day 2, 3, 4, or 5 of fever in patients with primary dengue virus type 3 infection (blue circle) and on any day postvaccination (green circle). Numbers indicate transcripts unique to vaccination, infection, or shared (overlap, n = 246). B, Maximum fold-change in transcript abundance following vaccination (red circles) or during infection (blue diamonds). C, Maximum fold-change in abundance for transcripts with significant changes postvaccination or during infection. Dotted diagonal line at equal fold-change included for reference.

