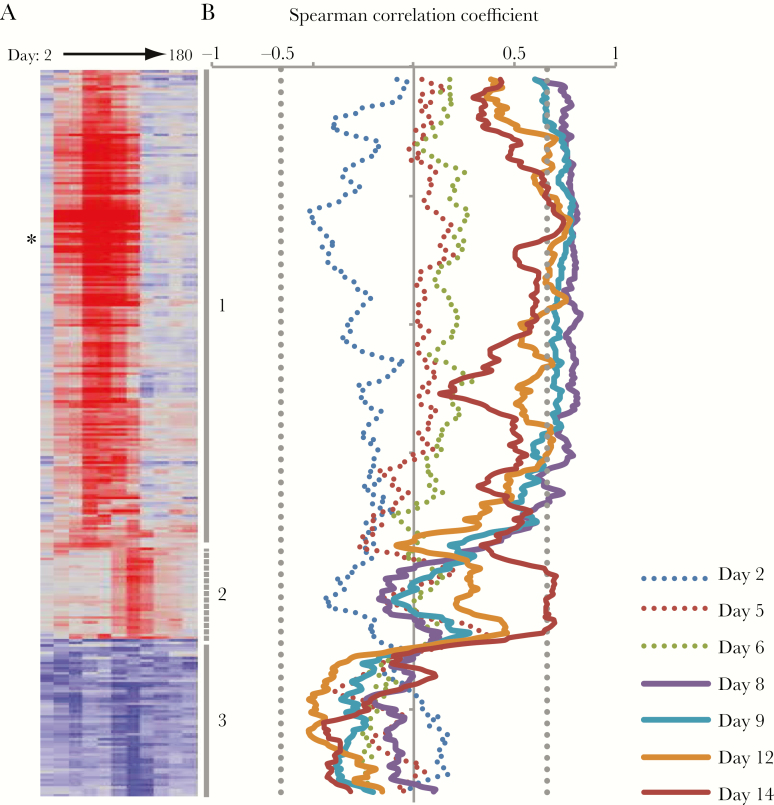
Figure 5.
Correlation of transcript abundance and the 60% plaque reduction neutralization titer (PRNT60) at day 42 among vaccine recipients. A, Average fold-change in abundance by day for all transcripts with significant differences from baseline postvaccination. Transcripts are ordered and clusters labeled as in Figure 2. Asterisk marks IFI44. B, Spearman correlation of each transcript and day 42 PRNT60 using a moving average of window size 9. Solid lines indicate days postvaccination on which a significant correlation was identified (P < .01, indicated by vertical dotted gray line).

