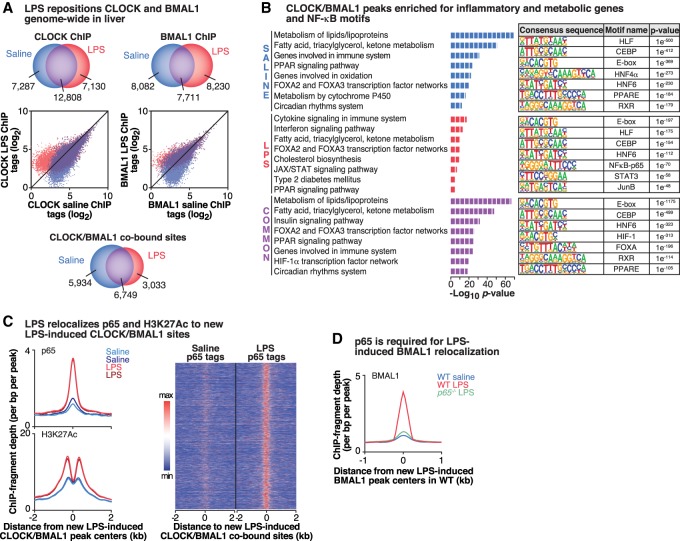
Figure 2.
Activation of NF-κB transcription repositions CLOCK/BMAL1 binding genome-wide. (A, top) Venn diagrams depicting the number of CLOCK- and BMAL1-binding peaks in each condition. (Middle) Scatter plots depicting log transformed CLOCK and BMAL1 ChIP-seq tag densities. Points above the 45° line represent sites inducibly bound by CLOCK or BMAL1 following LPS stimulation, while points below the line are peaks with diminished CLOCK or BMAL1 occupancy following LPS stimulation. (Bottom) Venn diagrams using only the CLOCK/BMAL1-cobound sites. n = 2 per condition per antibody. (B, left panels) Functional pathway analysis (Panther) of the sites cobound by CLOCK/BMAL1 in saline- and LPS-stimulated conditions identified enriched functional pathways in each condition. (Right panels) The top known HOMER motifs enriched at CLOCK/BMAL1-binding sites from ChIP-seq analysis in saline- and LPS-stimulated livers. (C) Histograms representing the occurrence of p65 (top) and H3K27ac (bottom) peaks within 2 kb of new LPS-induced CLOCK/BMAL1 peak centers. Heat map comparing binding of p65 within 2-kb windows surrounding new LPS-induced CLOCK/BMAL1-cobound peaks following either saline or LPS stimulation. (D) Histogram representing the occurrence of BMAL1 peaks within 1 kb of new LPS-induced BMAL1 peak centers in wild type. n = 2 per condition. See also Supplemental Figure S2.

