
Figure 3.
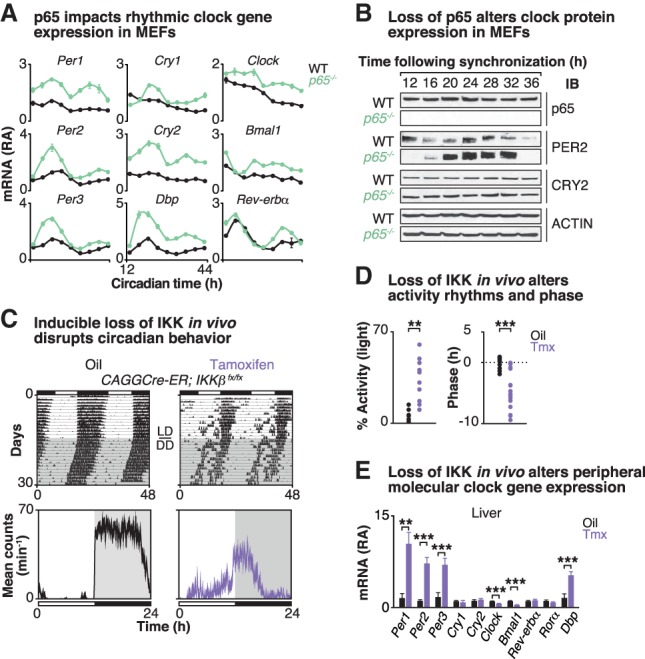
Loss of p65/IKKβ disrupts molecular clock expression and behavioral rhythms. (A) Quantitative RT–PCR analysis of rhythmic expression of core clock genes in forskolin-synchronized wild-type MEFs (black) compared with p65 knockout (green) MEFs. Cells were harvested at 4-h intervals for a full circadian cycle, starting 12 h following forskolin synchronization. Data are represented as mean ± SEM. n = 2–3 independent experiments, each with four samples per experiment. P ≤ 0.001, two-way ANOVA between wild-type and p65 knockout MEFs for all clock genes shown. (B) Representative Western blot analysis (n = 2–3) of expression of core clock proteins in forskolin-synchronized wild-type MEFs compared with p65 knockout MEFs collected at 4-h intervals as above. (C, top panels) Representative actograms showing wheel-running activity from CAGGCre-ER;IKKβfx/fx mice (>2 mo old). Mice were first injected with either oil or tamoxifen once per day for five consecutive days and then maintained on a 12:12 light:dark (LD) cycle in wheel cages for 15 d prior to release to constant darkness (DD). (Bottom panels) Representative locomotor activity profiles of CAGGCre-ER;IKKβfx/fx mice that received either oil (black) or tamoxifen (purple) are shown. (D) The percentage of total activity occurring in the light period (left; n = 6–10) and the phase angle of entrainment relative to the time of lights off (right; n = 12–16) are shown. (E) Quantitative RT–PCR analysis of core clock gene expression in the liver at ZT4. Values are displayed as relative abundance compared with values of oil-treated mice after normalization to Gapdh. n = 10–11. Data are represented as mean ± SEM. (**) P ≤ 0.01; (***) P ≤ 0.001, unpaired t-test. See also Supplemental Figure S3.