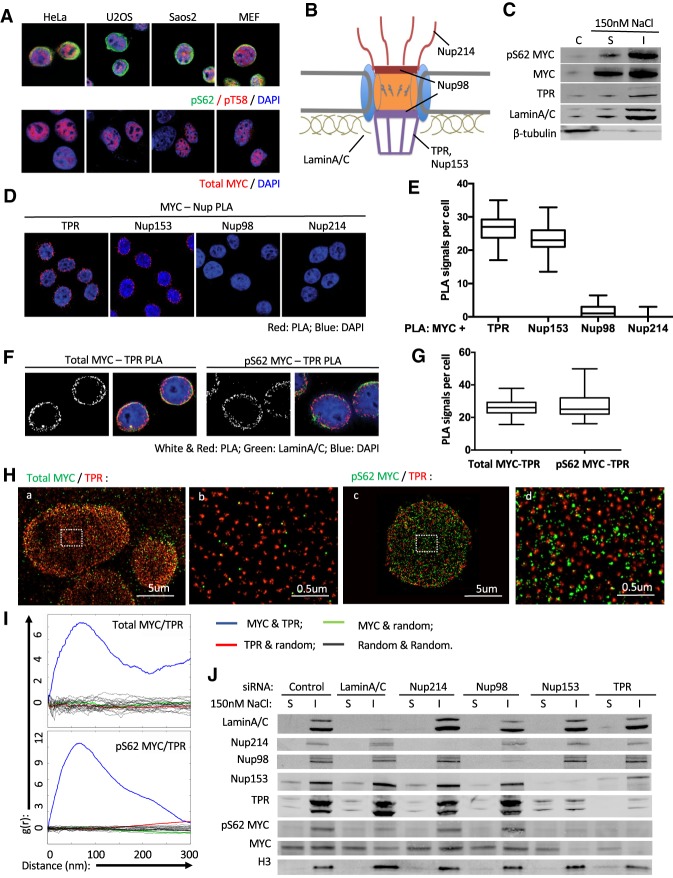
Figure 1.
pS62MYC associates with the nuclear pore basket. (A) Immunofluorescence (IF) staining through confocal imaging (Zeiss, LSM 880) of pS62MYC (red; top) together with pT58MYC (green; top) and total MYC (red; bottom) in HeLa, Saos2, and U2OS cells and mouse embryonic fibroblasts (MEFs). Phospho-antibody specificity is shown in Supplemental Figure S1A. Single-channel staining is shown in Supplemental Figure S1C. The pT58 and total MYC staining are consistent in all cells; the percentages of nuclear peripheral pS62 staining across cells in each line are quantified in Supplemental Figure S1D. (B) A schematic of the NPC with representative nuclear porins labeled. (C) Western blot of subcellular distribution of pS62MYC and total MYC in cytoplasmic (C), nuclear-soluble (S), and nuclear-insoluble (I) fractions of HeLa cells by 150 nM NaCl nuclear extraction. Lamin A/C and TPR represent nuclear markers; β-tubulin represents a cytoplasmic marker. (D) PLA of MYC association with nuclear porins (Nups) in HeLa cells. The PLA signals (red) are overlaid with DAPI (blue) from confocal imaging. (E) Quantification of PLA signals in D; the whiskers represent 5%–95% intervals, and the box represents median and 25%–75% intervals of PLA signals per cell from 50 cells per condition. Data are representative of three independent experiments. (F) PLA of total MYC and pS62MYC with TPR (red) in HeLa cells. (Green) Lamin A/C; (blue) DAPI. (G) Quantification similar to E of PLA signals in F. (H) STORM analysis of colocalization of total MYC and pS62MYC with TPR. Total MYC (green; panel a) and pS62MYC (green; panel c) with TPR (red) at a focal plane near the bottom of the nucleus. (Panels b, d) Zoom on a part of each left image. (I) Plots of pair correlation functions showing the density variation of a total MYC or pS62MYC signal on the Y-axis as a function [g(r)] of radial distance (in nanometers) on the X-axis from a TPR signal (blue lines). Shown also are the plots of MYC or pS62MYC against random signal (green), TPR against random signal (red), and random signal against random signal (gray). (J) Western blot of the indicated proteins showing subnuclear distribution of pS62MYC and total MYC in nuclear-soluble (S) and nuclear-insoluble (I) fractions of HeLa cells by 150 nM NaCl nuclear extraction with control or siRNA knockdown of the indicated nuclear peripheral components. Histone 3 (H3) marks the insoluble fraction.

