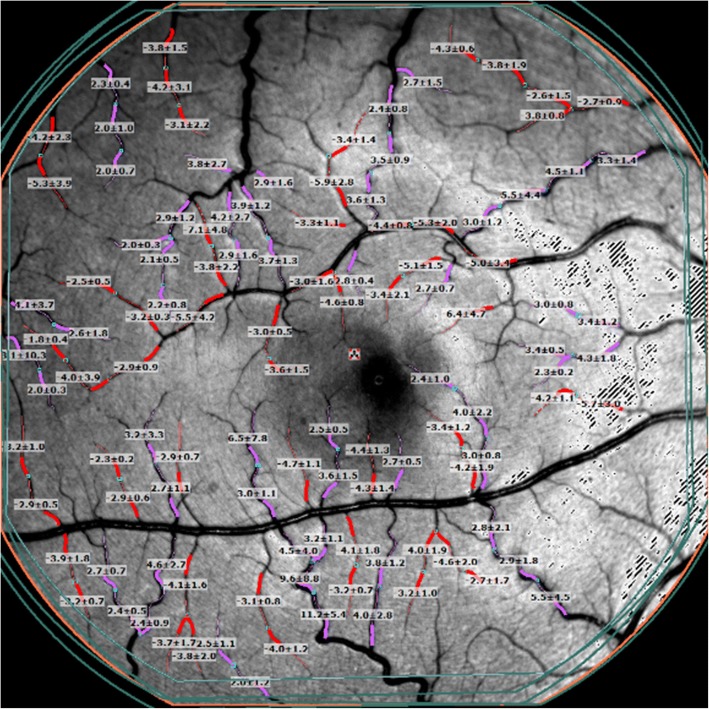
Fig. 1.
RFI image of the retina with overlaid blood flow velocity measurements. The retinal microvasculature network, centered on the fovea, was imaged to create at least 4 series of at least 4 sequential images. Secondary and tertiary branches in the visible region of the vessel map were manually outlined in segments of 60 to 90 pixels. The arteriolar (red) and venular (pink) vessel segments drawn on the vessel map marked the locations where the automated software detected blood flow. A blood flow velocity (BFV) measurement in mm/s was calculated for each corresponding vessel segment

