Fig. 5.

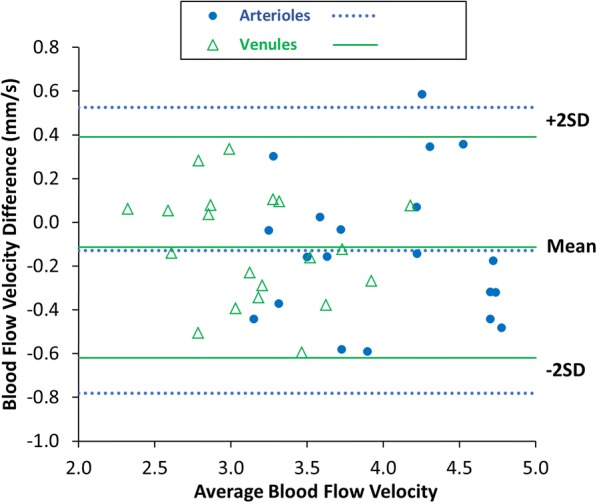
Bland Altman mean difference plot to compare blood flow velocities (BFVs) between OD and OS in the healthy control group (N = 20, 40 eyes). The difference plot shows good agreement between the OD and OS BFVs with no obvious bias

Bland Altman mean difference plot to compare blood flow velocities (BFVs) between OD and OS in the healthy control group (N = 20, 40 eyes). The difference plot shows good agreement between the OD and OS BFVs with no obvious bias