Fig. 1.
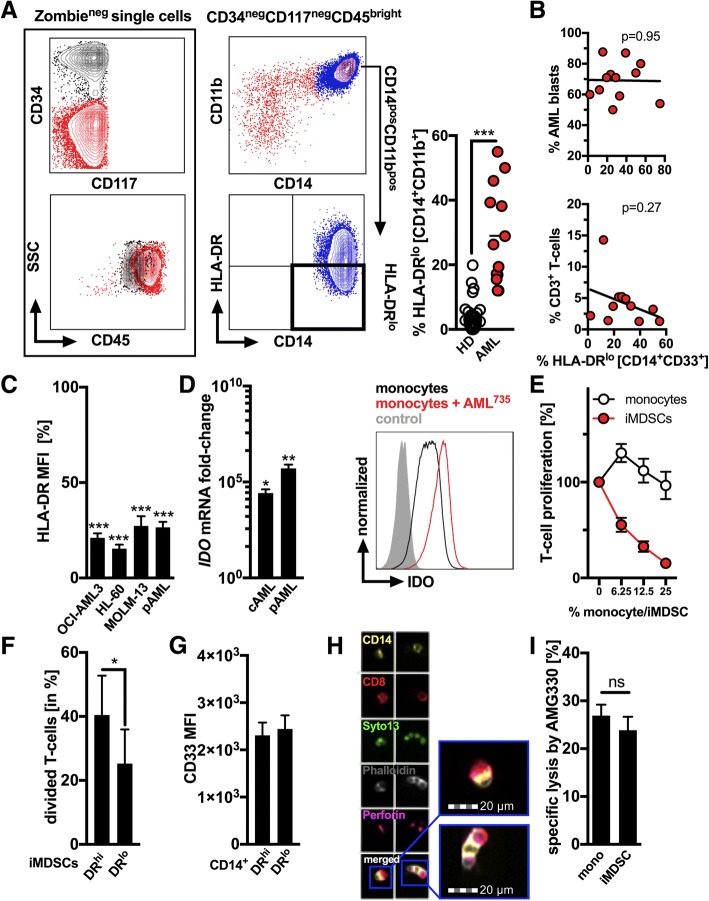
Primary AML-blasts and AML cell lines promote induction of CD14+ CD33+ IDO+ HLA-DRlo MDSCs that are targeted by AMG 330. (a) A representative FACS-based analysis of MDSCs within AML patient-derived PBMCs is shown. HLA-DR expression was analyzed in CD14+ CD11b+ monocytic cells (right panels) among the viable (Zombieneg) CD45hi CD34neg CD117neg (left panels) cell fraction. Frequency of HLA-DRlo cells was assessed in untreated AML patients (n = 13) and healthy controls (HD, n = 37). (b) Correlation of the proportion of HLA-DRlo cells within the CD14+ population (n = 13) with frequency of circulating AML-blasts (upper panel) and of CD3+ T-cells (lower panel). (c) Expression levels of HLA-DR based on the median fluorescence index (MFI) were measured by FACS on HD-derived purified CD14+ monocytes following 5 days of culture in the presence/absence of AML cell lines (OCI-AML3, HL-60, and MOLM-13, n = 5) and primary AML-blasts (n = 9). Monocytes cultured alone are set as 100%. (d) The relative gene expression (mRNA) of indoleamine-2,3-dioxygenase (IDO) in monocytes cultured in the presence/absence of AML cell lines (cAML, n = 6) and primary AML-blasts (pAML, n = 10) was semi-quantified by qPCR. Monocytes cultured alone are set as 1. A representative (for n = 10) histogram of a FACS analysis of IDO expression in monocytes cultured alone (control) or in presence of primary AML-blasts as shown for cells from the patient with the unique patient number 735 (AML735). (e) The dose-dependent suppressive activity of HD-derived monocytes and HD-derived monocytes re-educated by cAML (=induced MDSCs (iMDSCs)) was evaluated in co-cultures with VPD450-labeled autologous T-cells activated using anti-CD2, -CD3, and -CD28 microbeads. T-cell proliferation was assessed based on the VPD450 dye dilution after 5 days by FACS and compared with stimulated T-cells alone (set as 100%). (f) Suppressive activity of FACS-sorted HLA-DRhi and HLA-DRlo iMDSCs was separately evaluated in co-culture experiments (n = 4) with autologous T-cells. (g) Cell surface expression of CD33 was semi-quantified by FACS on HLA-DRlo and HLA-DRhi CD14+ monocytes (n = 10). (h) Representative (for at least three independent experiments) FACS-imaging of cytotoxic CD8+ T-cells (red) conjugated with autologous CD14+ monocytes (yellow). Nucleic acids were counter-stained with Syto13 (green), actin with phalloidin (grey), and perforin formation additionally visualized (pink). (i) Calcein-labeled monocytes or iMDSCs (n = 10) were co-cultured with pre-stimulated autologous T-cells at a 1:10 ratio for three hours and the release of calcein measured using fluorimetric assay. Bars indicate the standard error of the mean. Abbreviations: *, p < 0.05; **, p < 0.01; ***, p < 0.001

