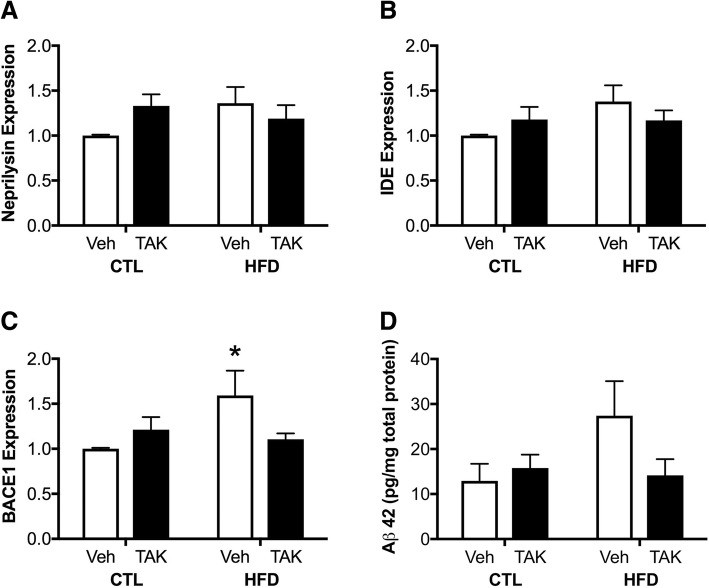
Fig. 7.
Expression of Aβ production and degrading factors and soluble Aβ42 in mice fed a control (CTL) or high-fat diet (HFD) and treated with vehicle (Veh) or the TLR4 inhibitor TAK-242 (TAK). a–c Hippocampal gene expression of the Aβ clearance factors a neprilysin, and b insulin-degrading enzyme, and the Aβ production factor c BACE1, as assessed by qPCR. Data show fold differences relative to vehicle-treated mice fed a control diet. d Protein levels of soluble Aβ42 as measured by ELISA (expressed as pg Aβ42 per to mg total protein). Data are presented as mean (±SEM) values; n = 10/group. Vehicle-treated animals are shown in white bars, and TAK-242-treated are shown in black bars. Statistical significance is based on ANOVA followed by Bonferroni correction. *p < 0.05 relative to drug treatment-matched mice in control diet condition

