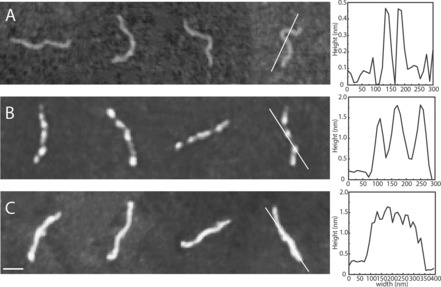
Figure 3.

Tapping mode atomic force microscopy images of DNA (1 kb, 5 μm base pairs) with aS at a concentration of (A) 0 μm, (B) 0.1 μm and (C) 40 μm. The scale bar is 100 nm. The line in each panel corresponds to the height profile of the molecule shown to the right. Mica (A) and silica (B and C) surfaces were used (see Materials and Methods for details).
