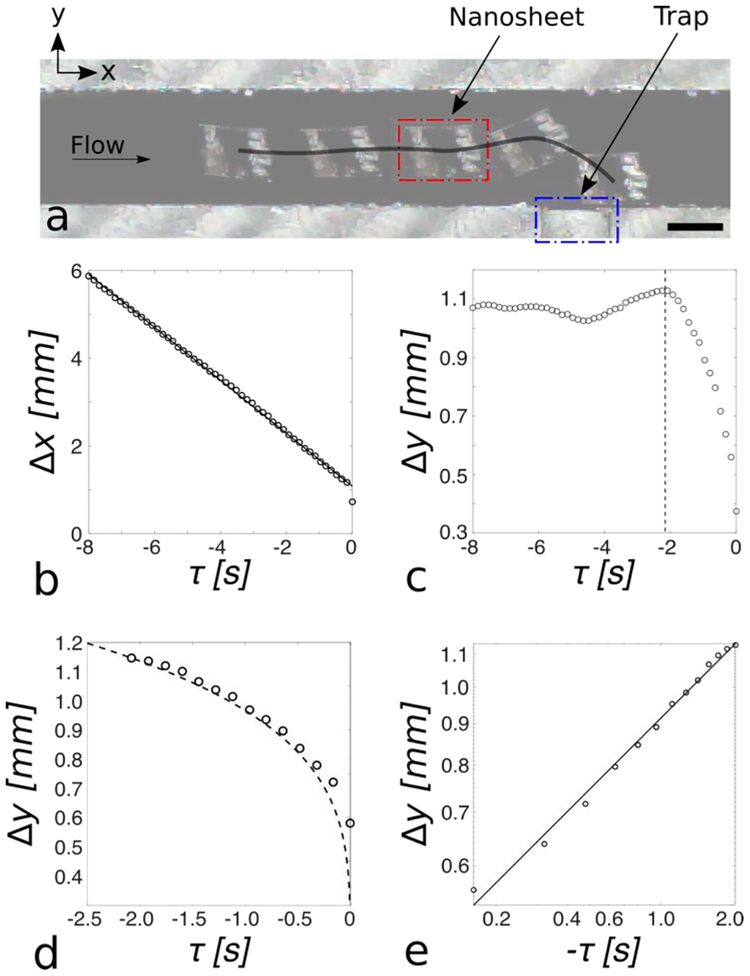
Figure 3.
(a) A typical nanosheet trajectory is shown (black line). A nanosheet (red outline) travels downstream (positive x-direction) towards the trap (blue outline). As the nanosheet approaches the trap, it is attracted towards the trap and comes to rest with one edge mated against the channel wall. Scale bar: 1 mm. (b) Mean (n=48 trials) x-direction nanosheet centroid-to-trap distance plotted as a function of time (black circles) with linear regression line overlayed (solid black line). The x-direction centroid-to-trap distance is linear as a function of time (r2 = 0.99), indicating steady-state hydrodynamic transport. (c) Mean (n=48 trials) y-direction nanosheet centroid-to-trap distance plotted as a function of time (black circles). The black dashed line indicates the time at which the nanosheet RMS centroid-to-trap distance is equal to the capillary length of water (2.7 mm). (d) Experimental, mean (n = 48), y-direction centroid-to-trap distance plotted as a function of time (black circles) after the nanosheet is within one capillary length of the trap with overlayed mathematical model (dashed black line), root mean square error (RMSE), 0.28 mm. The experiment data shows good alignment with a mathematical quadrupole-monopole capillary interaction model. (e) y-direction centroidto-trap distance plotted vs. time on a log-log scale (black circles), with overlayed linear regression line (solid black line, α = 0.29, r2 = 0.99). The nanosheet’s y-direction centroid-to-trap distance as a function of time is well described by a power law (i.e., y ~ tα), with α = 0.29, indicating trapping of nanosheets via capillary quadrupolar interactions.

