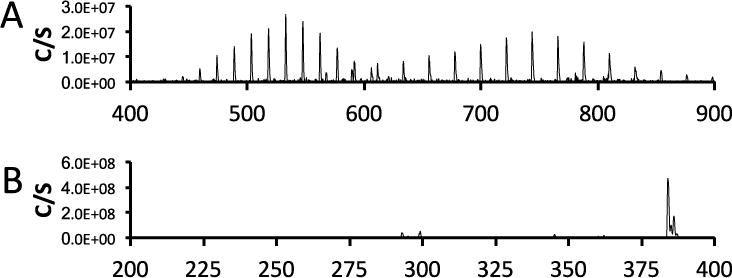
Figure 6.

Mass spectra of compounds identified in the TLC analysis of the plasma sample obtained at 1 minute post injection A: Spectrum obtained from material at an Rf of 0 - 0.1 (Blue arrows in Figure 5) and indicates the presence of proteins, triglycerides and diglycerides. C: Spectrum from peak at Rf = 0.9 (Green arrow in Figure 5) indicates the presence of the intact PF-367.
